Content

Photo UNL City Campus, home of this website since June 2001.
UNL Office of Communication and Marketing.
Last Month's Data (August 2026) Next Month's Data (October 2026)

Year 2026 (and last year) Lincoln precipitation (inches), rain + melted snow
| JAN | FEB | MAR | APR | MAY | JUN | JUL | AUG | SEP | OCT | NOV | DEC | TOTAL | |
| Normal | 0.73 | 0.89 | 1.55 | 2.69 | 4.91 | 4.48 | 3.25 | 3.32 | 2.90 | 2.14 | 1.30 | 1.18 | 29.34 |
| 2026 | 0.95 | 0.44 | 0.22 | 2.47 | 4.65 | 4.09 | 6.78 | 4.75 | 11.49 | 35.84 | |||
| 2025 | 0.10 | 0.31 | 0.95 | 1.71 | 3.05 | 3.22 | 3.93 | 4.89 | 3.53 | 1.94 | 0.61 | 0.25 | 24.49 |
Normal January 1 - August 31 Precipitation total = 21.82 inches
Normal January 1 - September 30 Precipitation total = 24.72 inches
September 2026 Daylight
September 1: Sunrise 6:53am; Sunset 7:58pm (Daylight 13 hr 5 min)
September 30: Sunrise 7:22am; Sunset 7:10pm (Daylight 11 hr 48 min)
RECORDS:
Tied Record Warm overnight low 76° September 2, 2026: First set in 1913
Record Warm overnight low 79° September 3, 2026: Old record 75° set in 1937
Record daily precipitation Sept. 30, 2026: 6.15" (old record 3.30" Sept. 30, 2014)
Record daily precipitation any day of the year Sept. 30, 2026: 6.15" (old record 5.45" Aug. 29, 1910)
Record monthly precipitation Sept. 2026: 11.49" (old record 8.32" set in 1914)
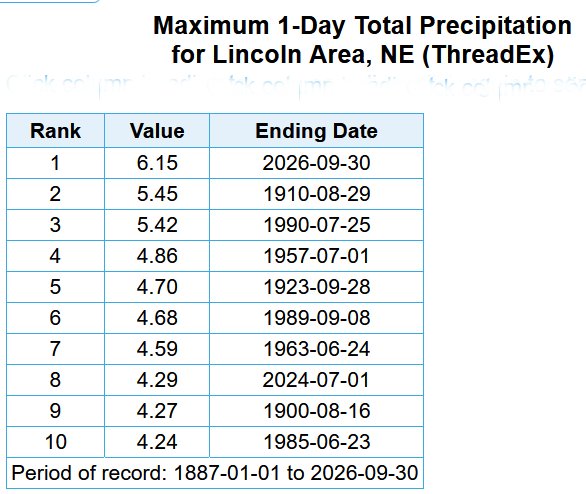
September 30, 2026 Greatest precipitaion for any day in the year.
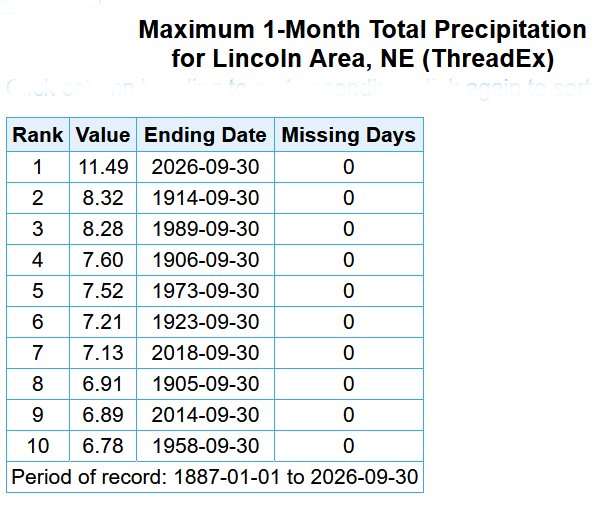
September 2026 wettest September on Record.

September 2026, 4th warmest on record.
Lincoln's Hot Weather Climatology: Hot weather climatology
.
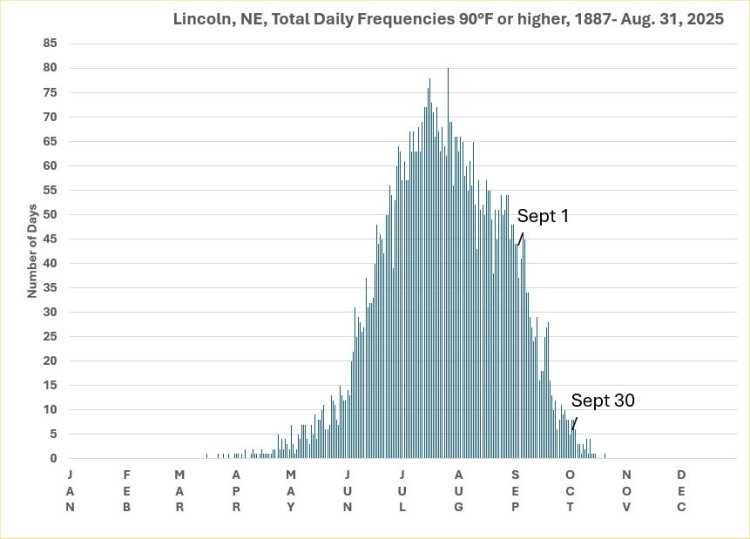
All data in the following table are from the National Weather Service and HPRCC data archives.
| September | 2026 | Max | Min | Mean | Dep | Pcpn | Rec Pcpn | Rec Max | Rec Min | HDD | CDD | Norm Max | Norm Min | Norm Mean |
|---|---|---|---|---|---|---|---|---|---|---|---|---|---|---|
| Tuesday | Sept. 1 | 97 | 70 | 84 | +12 | 0.00 | 2.60 | 106 | 42 | 0 | 19 | 85 | 60 | 72 |
| Wednesday | Sept. 2 | 99 | 76 | 88 | +16 | T | 2.42 | 106 | 43 | 0 | 23 | 84 | 60 | 72 |
| Thursday | Sept. 3 | 98 | 79 | 89 | +17 | 0.00 | 2.37 | 102 | 35 | 0 | 24 | 84 | 59 | 72 |
| Friday | Sept. 4 | 99 | 76 | 88 | +17 | 0.00 | 2.15 | 102 | 40 | 0 | 23 | 84 | 59 | 71 |
| Saturday | Sept. 5 | 98 | 73 | 86 | +15 | 0.00 | 3.06 | 103 | 43 | 0 | 21 | 84 | 59 | 71 |
| Sunday | Sept. 6 | 92 | 72 | 82 | +11 | T | 1.91 | 105 | 41 | 0 | 17 | 83 | 58 | 71 |
| Monday | Sept. 7 | 97 | 70 | 84 | +14 | 0.00 | 2.01 | 104 | 42 | 0 | 19 | 83 | 58 | 70 |
| Tuesday | Sept. 8 | 101 | 73 | 87 | +17 | 0.40 | 4.68 | 103 | 40 | 0 | 22 | 83 | 58 | 70 |
| Wednesday | Sept. 9 | 83 | 67 | 75 | +5 | 0.07 | 4.22 | 100 | 36 | 0 | 10 | 83 | 57 | 70 |
| Thursday | Sept. 10 | 87 | 59 | 73 | +4 | 0.00 | 2.37 | 101 | 38 | 0 | 8 | 82 | 57 | 69 |
| Friday | Sept. 11 | 90 | 64 | 77 | +8 | 0.13 | 1.59 | 99 | 29 | 0 | 12 | 82 | 56 | 69 |
| Saturday | Sept. 12 | 73 | 59 | 66 | -3 | 0.32 | 2.44 | 96 | 32 | 0 | 1 | 82 | 56 | 69 |
| Sunday | Sept. 13 | 66 | 59 | 63 | -5 | 0.05 | 1.41 | 102 | 34 | 2 | 0 | 81 | 56 | 68 |
| Monday | Sept. 14 | 85 | 59 | 72 | +4 | 0.63 | 2.28 | 99 | 34 | 0 | 7 | 81 | 55 | 68 |
| Tuesday | Sept. 15 | 75 | 58 | 67 | -1 | 0.94 | 1.96 | 99 | 31 | 0 | 2 | 81 | 55 | 68 |
| Wednesday | Sept. 16 | 71 | 59 | 65 | -2 | 0.28 | 2.53 | 100 | 34 | 0 | 0 | 80 | 54 | 67 |
| Thursday | Sept. 17 | 80 | 65 | 73 | +6 | 0.05 | 1.94 | 101 | 35 | 0 | 8 | 80 | 54 | 67 |
| Friday | Sept. 18 | 97 | 70 | 84 | +17 | 0.00 | 2.54 | 100 | 31 | 0 | 19 | 80 | 53 | 67 |
| Saturday | Sept. 19 | 81 | 65 | 73 | +5 | T | 1.55 | 100 | 29 | 0 | 8 | 79 | 53 | 66 |
| Sunday | Sept. 20 | 67 | 61 | 64 | -2 | T | 2.61 | 103 | 31 | 1 | 0 | 79 | 53 | 66 |
| Monday | Sept. 21 | 73 | 59 | 66 | +1 | 0.01 | 1.43 | 103 | 32 | 0 | 1 | 78 | 52 | 65 |
| Tuesday | Sept. 22 | 69 | 56 | 63 | -2 | 0.00 | 2.62 | 99 | 27 | 2 | 0 | 78 | 52 | 65 |
| Wednesday | Sept. 23 | 74 | 55 | 65 | +1 | 0.01 | 3.63 | 97 | 31 | 0 | 0 | 78 | 51 | 64 |
| Thursday | Sept. 24 | 66 | 62 | 64 | 0 | 0.66 | 1.74 | 93 | 31 | 1 | 0 | 77 | 51 | 64 |
| Friday | Sept. 25 | 64 | 60 | 62 | -2 | 0.95 | 2.32 | 93 | 29 | 3 | 0 | 77 | 50 | 64 |
| Saturday | Sept. 26 | 78 | 62 | 70 | +7 | 0.83 | 1.60 | 95 | 28 | 0 | 5 | 76 | 50 | 63 |
| Sunday | Sept. 27 | 81 | 63 | 72 | +9 | 0.00 | 1.37 | 94 | 32 | 0 | 7 | 76 | 49 | 63 |
| Monday | Sept. 28 | 77 | 63 | 70 | +8 | 0.00 | 4.70 | 102 | 28 | 0 | 5 | 75 | 49 | 62 |
| Tuesday | Sept. 29 | 77 | 65 | 71 | +9 | 0.01 | 1.75 | 96 | 26 | 0 | 6 | 75 | 49 | 62 |
| Wednesday | Sept. 30 | 73 | 66 | 70 | +9 | 6.15 | 6.15 | 96 | 28 | 0 | 5 | 75 | 48 | 61 |
| . | 2026 | Max | Min | Mean | Dep | Pcpn | Rec Pcpn | Rec Max | Rec Min | HDD | CDD | Avg Max | Avg Min | Avg Mean |
| . | TOTAL | 11.49 | 9 | 272 | ||||||||||
| . | AVERAGE | 82.3 | 64.8 | 73.6 | ||||||||||
| NORMAL | 80.1 | 54.3 | 67.2 | 2.90 | 77 | 143 | ||||||||
| DEPARTURE | .+2.2 | +10.5 | +6.4 | +8.59 | -68 | +129 |
AVERAGE AND TOTAL are SEPTEMBER 2026.
Temperature is °F
Precipitation measurement is "inches"
Precipitation "T" = trace, precipitation was observed but not enough to be measured
NORMAL (Norm) refers to the 1991-2020 Standard normals
DEPARTURE is SEPTEMBER 2026 Averages and totals measured against 1991-2020 Normals.
Max = Observed Maximum and Min = Observed Minimum temperatures in °F.
Mean = Observed Mean Daily temperature in °F.
Dep = Departure from normal ( - is below normal, + is above normal, in °F)
Pcpn = Observed daily precipitation (midnight to midnight, CST) in inches.
Rec Pcpn = Record daily amount of precipitation in inches.
Rec Max = Record maximum temperature in °F.
Rec Min = Record Minimum temperature in °F.
HDD = heating degree day units (base of 65 degrees) in °F.
CDD = cooling degree day units (base of 65 degrees) in °F.
Norm Max = Daily Normal High Temperature (1991-2020 normals) in °F.
Norm Min = Daily Normal Low Temperature (1991-2020 normals) in °F.
Norm Mean = Daily Normal Mean Temperature (1991-2020 normals) in °F.
From the record books:
Hottest recorded September temperature, 106°F, September 2, 2000 and September 1, 1922
Coldest recorded September temperature, 26°F, September 29, 1984.
Earliest ever first snowfall, September 28, 1985, 0.8 inches.
There is only been one measurable snowfall in September from 1897 to 2025
Wettest September, 8.32 inches, 1914
Driest September, 0.00 inches, 1894
NOTE: All data on this page are from the National Weather Service and HPRCC data archives.