Content

Spring color in Lincoln
Weather Camp June 11-16, 2023 Registration Link
Related Links:
Last month's Data: February 2023
Next Month's Data: April 2023
Lincoln's Cold Weather Climatology
Lincoln's Snowfall Climatology
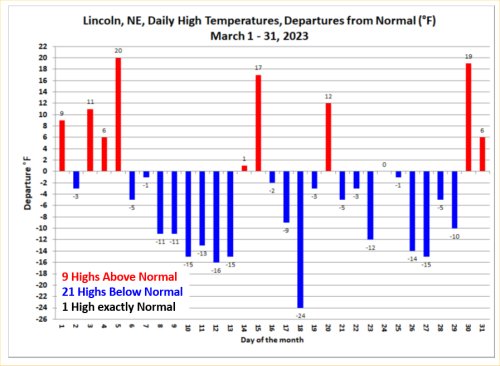
March 2023 High Temperatures Departures Graph
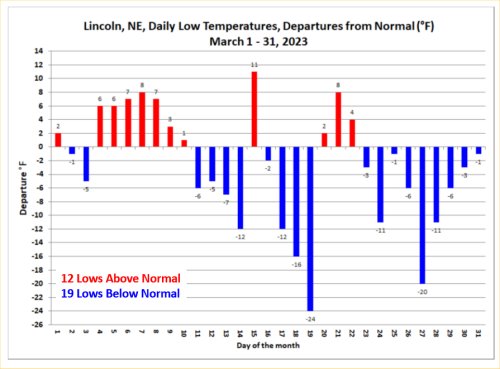
March 2023 Low Temperatures Departures Graph
Winter 2022-23 (and last 4 years) Snowfall (in inches) compared to normal.
| OCT | NOV | DEC | JAN | FEB | MAR | APR | MAY | TOTAL | |
| Normal | 0.9 | 1.5 | 5.3 | 6.5 | 7.1 | 3.4 | 1.2 | 0.1 | 26.0 |
| 2022-23 | 0.0 | T | 1.6 | 2.0 | 9.5 | 1.2 | 14.3 | ||
| 2021-22 | 0.0 | T | 0.8 | 2.9 | 0.1 | 1.3 | T | 0.0 | 5.1 |
| 2020-21 | 2.9 | T | 11.0 | 18.9 | 16.6 | 0.0 | T | 0.0 | 49.4 |
| 2019-20 | 0.7 | 1.7 | 1.8 | 5.5 | 1.6 | 1.5 | 4.8 | 0.0 | 17.6 |
| 2018-19 | 3.5 | 7.2 | 5.6 | 9.7 | 23.2 | 6.3 | T | 0.0 | 55.5 |
T = a Trace. Snowfall was observed but not enough to be measured
Year 2023 (and last year) Lincoln Precipitation in Inches compared to normal
| JAN | FEB | MAR | APR | MAY | JUN | JUL | AUG | SEP | OCT | NOV | DEC | TOTAL | |
| Normal | 0.73 | 0.89 | 1.55 | 2.69 | 4.91 | 4.48 | 3.25 | 3.32 | 2.90 | 2.14 | 1.30 | 1.18 | 29.34 |
| 2023 | 1.32 | 1.29 | 0.63 | . | . | . | . | . | . | . | . | . | 3.24 |
| 2022 | 0.28 | 0.03 | 1.96 | 3.05 | 5.27 | 3.73 | 2.57 | 0.55 | 0.97 | 0.61 | 0.26 | 0.64 | 19.92 |
ANNOUNCEMENT: UNL National Weathercamp is scheduled for June 11-16, 2023.
All data in the following table are from the National Weather Service and HPRCC data archives.
NOTE: New 1991-2020 Climate Normals added to the table
>>>>record highs, lows xmacis verified 2023
If columns are hidden, scroll the table right.
| March | 2023 | Max | Min | Mean | Dep | Pcpn | Rec Pcpn | Rec Max | Rec Min | HDD | CDD | Norm Max | Norm Min | Norm Mean | Snow |
|---|---|---|---|---|---|---|---|---|---|---|---|---|---|---|---|
| Wednesday | Mar. 1 | 55 | 25 | 40 | +5 | 0.00 | 0.62 | 81 | -6 | 25 | 0 | 46 | 23 | 35 | . |
| Thursday | Mar. 2 | 44 | 23 | 34 | -1 | 0.00 | 0.55 | 81 | -7 | 31 | 0 | 47 | 24 | 35 | . |
| Friday | Mar. 3 | 58 | 19 | 39 | +3 | 0.00 | 0.92 | 78 | -10 | 26 | 0 | 47 | 24 | 36 | . |
| Saturday | Mar. 4 | 54 | 30 | 42 | +6 | 0.00 | 0.88 | 80 | -19 | 23 | 0 | 48 | 24 | 36 | . |
| Sunday | Mar. 5 | 68 | 31 | 50 | +13 | 0.00 | 1.16 | 76 | -7 | 15 | 0 | 48 | 25 | 37 | . |
| Monday | Mar. 6 | 44 | 32 | 38 | +1 | 0.00 | 0.58 | 80 | -11 | 27 | 0 | 49 | 25 | 37 | . |
| Tuesday | Mar. 7 | 48 | 33 | 41 | +3 | 0.00 | 0.87 | 80 | -9 | 24 | 0 | 49 | 25 | 37 | . |
| Wednesday | Mar. 8 | 39 | 33 | 36 | -2 | 0.00 | 0.80 | 79 | -8 | 29 | 0 | 50 | 26 | 38 | . |
| Thursday | Mar. 9 | 39 | 29 | 34 | -4 | 0.14 | 0.57 | 82 | -2 | 31 | 0 | 50 | 26 | 38 | 0.7 |
| Friday | Mar. 10 | 36 | 28 | 32 | -7 | 0.00 | 0.87 | 78 | -7 | 33 | 0 | 51 | 27 | 39 | . |
| Saturday | Mar. 11 | 38 | 21 | 30 | -9 | 0.22 | 0.73 | 84 | -19 | 35 | 0 | 51 | 27 | 39 | T |
| Sunday | Mar. 12 | 36 | 22 | 29 | -11 | 0.00 | 1.11 | 81 | -15 | 36 | 0 | 52 | 27 | 40 | . |
| Monday | Mar. 13 | 37 | 21 | 29 | -11 | T | 0.68 | 83 | -5 | 36 | 0 | 52 | 28 | 40 | T |
| Tuesday | Mar. 14 | 54 | 16 | 35 | -6 | 0.00 | 0.86 | 82 | -5 | 30 | 0 | 53 | 28 | 41 | . |
| Wednesday | Mar. 15 | 70 | 39 | 55 | +14 | 0.00 | 0.88 | 85 | -1 | 10 | 0 | 53 | 28 | 41 | . |
| Thurday | Mar. 16 | 52 | 27 | 40 | -1 | 0.21 | 1.29 | 90 | -4 | 25 | 0 | 54 | 29 | 41 | 0.5 |
| Friday | Mar. 17 | 45 | 17 | 31 | -11 | T | 1.09 | 84 | -5 | 34 | 0 | 54 | 29 | 42 | T |
| Saturday | Mar. 18 | 31 | 14 | 23 | -19 | 0.00 | 1.80 | 87 | -7 | 42 | 0 | 55 | 30 | 42 | . |
| Sunday | Mar. 19 | 52 | 6 | 29 | -14 | 0.00 | 1.28 | 87 | -3 | 36 | 0 | 55 | 30 | 43 | . |
| Monday | Mar. 20 | 68 | 32 | 50 | +7 | 0.00 | 0.75 | 80 | -3 | 15 | 0 | 56 | 30 | 43 | . |
| Tuesday | Mar. 21 | 51 | 39 | 45 | +2 | 0.00 | 0.42 | 88 | 5 | 20 | 0 | 56 | 31 | 43 | . |
| Wednesday | Mar. 22 | 54 | 35 | 45 | +1 | T | 1.75 | 90 | 6 | 20 | 0 | 57 | 31 | 44 | T |
| Thursday | Mar. 23 | 45 | 28 | 37 | -7 | 0.00 | 1.41 | 88 | 7 | 28 | 0 | 57 | 31 | 44 | . |
| Friday | Mar. 24 | 57 | 21 | 39 | -6 | 0.00 | 1.64 | 83 | 7 | 26 | 0 | 57 | 32 | 45 | . |
| Saturday | Mar. 25 | 57 | 31 | 44 | -1 | 0.06 | 1.96 | 91 | 5 | 21 | 0 | 58 | 32 | 45 | . |
| Sunday | Mar. 26 | 44 | 26 | 35 | -10 | T | 1.21 | 88 | 2 | 30 | 0 | 58 | 32 | 45 | T |
| Monday | Mar. 27 | 44 | 13 | 29 | -17 | 0.00 | 0.98 | 84 | 6 | 36 | 0 | 59 | 33 | 46 | . |
| Tuesday | Mar. 28 | 54 | 22 | 38 | -8 | 0.00 | 1.74 | 90 | 11 | 27 | 0 | 59 | 33 | 46 | . |
| Wednesday | Mar. 29 | 49 | 27 | 38 | -8 | 0.00 | 1.34 | 89 | 12 | 27 | 0 | 59 | 33 | 46 | . |
| Thursday | Mar. 30 | 79 | 31 | 55 | +8 | T | 0.99 | 88 | 10 | 10 | 0 | 60 | 34 | 47 | . |
| Friday | Mar. 31 | 66 | 33 | 50 | +3 | 0.00 | 1.73 | 91 | 14 | 15 | 0 | 60 | 34 | 47 | . |
| March | 2023 | Max | Min | Mean | Dep | Pcpn | Rec Pcpn | Rec Max | Rec Min | HDD | CDD | Avg Max | Avg Min | Avg Mean | Snow |
| . | TOTAL | 0.63 | 823 | 0 | 1.2 | ||||||||||
| . | AVERAGE | 50.6 | 25.9 | 38.3 | |||||||||||
| NORMAL | 53.6 | 28.7 | 41.2 | 1.55 | 741 | 2 | 3.4 | ||||||||
| . | DEPARTURE | -3.0 | -2.8 | -2.9 | -0.92 | +82 | -2 | -2.2 |
AVERAGE AND TOTAL are MARCH 2023
Temperature is °F
Precipitation measurement is inches
Precipitation "T" = trace, precipitation was observed but not enough to be measured
NORMAL (Norm) refers to the 1991-2020 Standard Normals
DEPARTURE is MARCH 2023 Average measured against 1991-2020 normals, in °F.
Max = Observed Maximum and Min = Observed Minimum temperatures in °F.
Mean = Observed Mean Daily temperature in °F.
Dep = Departure from normal ( - is below normal, + above normal), in °F.
Pcpn = Observed daily precipitation (midnight to midnight, CST) in inches.
Rec Pcpn = Record daily amount of precipitation in inches.
Rec Max = Record Maximum temperature in °F.
Rec Min = Record Minimum temperature in °F.
HDD = heating degree day units (base of 65 degrees) in °F.
CDD = cooling degree day units (base of 65 degrees) in °F.
Norm Max = Daily Normal High Temperature (1991-2020 normals) in °F.
Norm Min = Daily Normal Low Temperature (1991-2020 normals) in °F.
Norm Mean = Daily Normal Mean Temperature (1991-2020 normals) in °F.
Snow = Snowfall in inches.
From the climate record books:
Warmest recorded MARCH temperature, 91°F, March 31, 2012 And, March 25, 1972.
Coldest recorded MARCH temperature, -19°F, March 4, 1978 and March 11, 1907.
SNOWFALL (127 years, 1897-2023):
Most MARCH Snowfall: 21.3 inches, 1912.
Least MARCH Snowfall:
0.0: 3 years AND, T (trace observed but not measurable): 14 years
No measurable snowfall 17 of the last 127 years = 13.3% of the years 1897-2023.
PRECIPITATION, rain plus melted snowfall (137 years, 1887-2023):
Driest March: 0.06 inches (1994)
Wettest March: 6.65 inches (1973)
NOTE: All data on this page are from the National Weather Service and HPRCC data archives.