Content
RETURN to the U.S. and Nebraska Tornadoes Page
It is difficult to compare Nebraska county totals without recognizing the large variation in county size.
A map of the Nebraska Counties with County names can be found at the bottom of this page.
For example in the 1950-2023 county tornado data set,
Cherry County had 96 tornadoes. York County had 49 tornadoes, about half the amount of Cherry County
However, the density of tornadoes in York County is significantly more? How is that possible?
Cherry County 5,961 sq miles, 96 tornadoes = 16.1 tornadoes per 1,000 sq miles for the period 1950-2023
York County 576 sq miles, 49 tornadoes = 85.1 tornadoes per 1,000 sq miles for the period 1950-2023
York County tornado density is more than 5 times greater than Cherry County
One of the best ways of showing this variation in density is through the creation of maps.
______________________________________________________________________
I had these maps, 1950-2015 data, prepared for me in the graphics Department of the School of Natural Resources, UNL.
The individual who did this for me has retired, so at this time I don't have anyone that I know of that can update these maps to the most recent data.
However. the pattern wouldn't change much if at all with the addition of the more recent tornado data.
Scroll through the four maps that I had created for the 1950-2015 data period and prepare to observe "Mt. Grand Island"
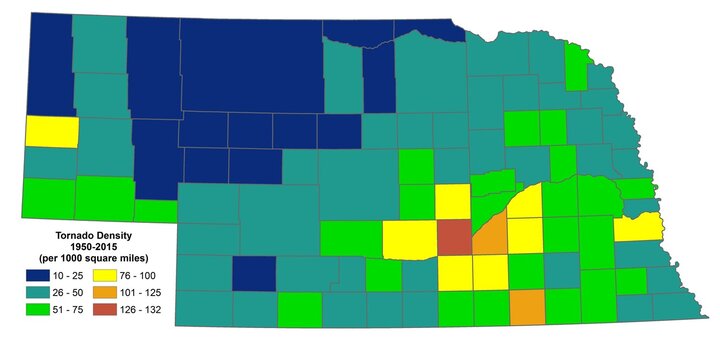
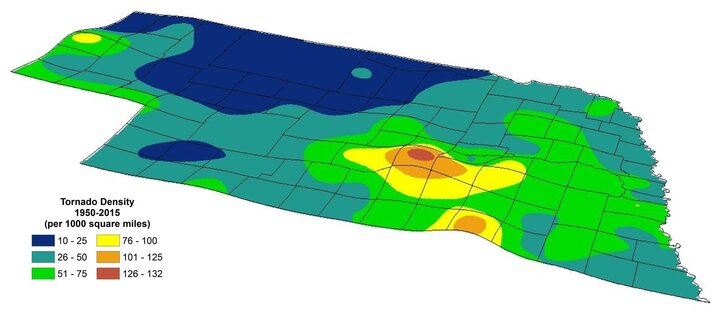
Tornado Density for each Nebraska County
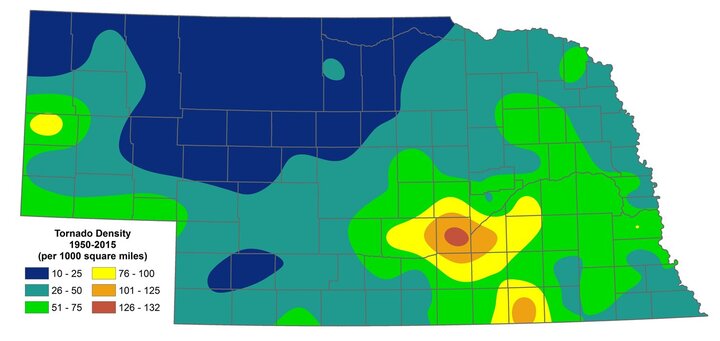
Tornado density, data smoothed across county borders
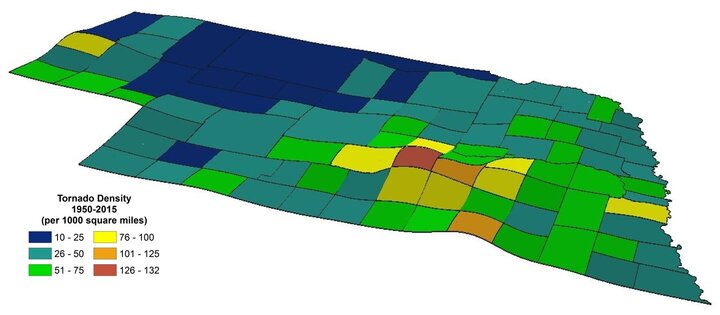
3-D Tornado Density for Each Nebraska County
3-D Tornado Density Smoothed Across Nebraska County Borders.
"Mt. Grand Island" Is the name given to Hall County and Grand Island with the greatest density of tornadoes in the state!