Content
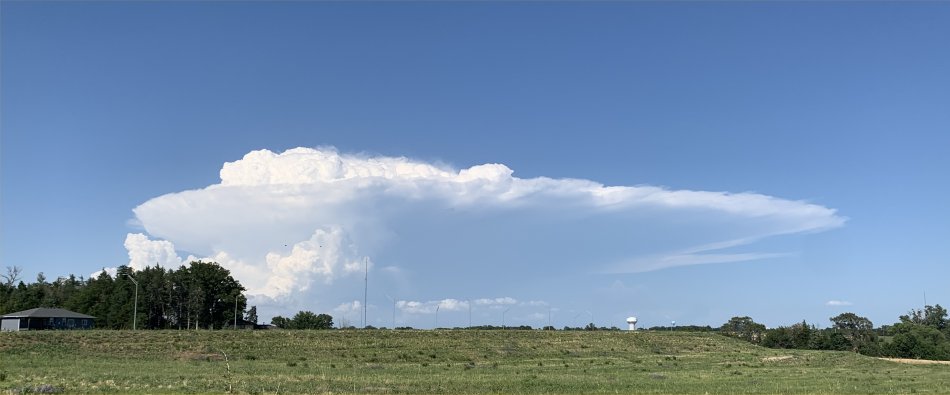
A June thunderstorm just to the East of Lincoln, NE
Last Month's Data (May 2026) Next Month's Data (July 2026)
Severe Weather our area June 11, 2026
Related Links
Lincoln's Hot Weather Climatology
List of all Daily Records and years set
June 3, 1980 Grand Island, NE, Tornadoes
List of all Daily Records and years set
Social Media
Daily FACEBOOK Weather Forecast Updates
Daily TWITTER Weather Forecast Updates
Daily BlueSky Forecast Updates
June 2026 Daylight:
June 1: Sunrise 5:57am; Sunset 8:52pm (Daylight 14hr 55min)
June 21: Summer Solstice (Greatest Daylight): Daylight 15hr 6min
June 30: Sunrise 5:58am; Sunset 9:02pm (Daylight 15hr 4min)
All data in the following tables are from the National Weather Service and HPRCC data archives.
Year 2026 (and last year) Lincoln precipitation (inches), rain + melted snow
| JAN | FEB | MAR | APR | MAY | JUN | JUL | AUG | SEP | OCT | NOV | DEC | TOTAL | |
| Normal | 0.73 | 0.89 | 1.55 | 2.69 | 4.91 | 4.48 | 3.25 | 3.32 | 2.90 | 2.14 | 1.30 | 1.18 | 29.34 |
| 2026 | 0.95 | 0.44 | 0.22 | 2.47 | 4.65 | 4.09 | 12.82 | ||||||
| 2025 | 0.10 | 0.31 | 0.95 | 1.71 | 3.05 | 3.22 | 3.93 | 4.89 | 3.53 | 1.94 | 0.61 | 0.25 | 24.49 |
Normal January 1 - May 31 Precipitation total = 10.77 inches
Normal January 1 - June 30 Precipitation total = 15.25 inches
All data in the following table are from the National Weather Service and HPRCC data archives.
| June | 2026 | Max | Min | Mean | Dep | Pcpn | Rec Pcpn | Rec Max | Rec Min | HDD | CDD | Norm Max | Norm Min | Norm Mean |
|---|---|---|---|---|---|---|---|---|---|---|---|---|---|---|
| Monday | June 1 | 89 | 65 | 77 | +8 | T | 3.02 | 96 | 40 | 0 | 12 | 81 | 58 | 69 |
| Tuesday | June 2 | 83 | 62 | 73 | +3 | 1.01 | 2.00 | 100 | 43 | 0 | 8 | 81 | 58 | 70 |
| Wednesday | June 3 | 86 | 61 | 74 | +4 | 0.00 | 2.44 | 97 | 40 | 0 | 9 | 82 | 58 | 70 |
| Thursday | June 4 | 74 | 66 | 70 | 0 | 0.51 | 2.64 | 100 | 40 | 0 | 5 | 82 | 59 | 70 |
| Friday | June 5 | 87 | 66 | 77 | +6 | 0.08 | 4.08 | 101 | 42 | 0 | 12 | 82 | 59 | 71 |
| Saturday | June 6 | 89 | 68 | 79 | +8 | 0.02 | 1.72 | 107 | 44 | 0 | 14 | 83 | 60 | 71 |
| Sunday | June 7 | 85 | 70 | 78 | +7 | T | 3.30 | 100 | 41 | 0 | 13 | 83 | 60 | 71 |
| Monday | June 8 | 90 | 70 | 80 | +8 | 0.00 | 2.92 | 102 | 39 | 0 | 15 | 83 | 60 | 72 |
| Tuesday | June 9 | 90 | 70 | 80 | +8 | 0.00 | 1.90 | 101 | 44 | 0 | 15 | 84 | 61 | 72 |
| Wednesday | June 10 | 94 | 68 | 81 | +9 | 0.05 | 2.02 | 106 | 43 | 0 | 16 | 84 | 61 | 72 |
| Thursday | June 11 | 81 | 60 | 71 | -2 | 1.55 | 3.03 | 103 | 44 | 0 | 6 | 84 | 61 | 73 |
| Friday | June 12 | 85 | 56 | 71 | -2 | 0.00 | 3.72 | 101 | 43 | 0 | 6 | 85 | 61 | 73 |
| Saturday | June 13 | 83 | 57 | 70 | -3 | 0.02 | 1.88 | 102 | 43 | 0 | 5 | 85 | 62 | 73 |
| Sunday | June 14 | 76 | 53 | 65 | -9 | T | 3.75 | 101 | 44 | 0 | 0 | 85 | 62 | 74 |
| Monday | June 15 | 83 | 49 | 66 | -8 | 0.00 | 2.88 | 108 | 44 | 0 | 1 | 85 | 62 | 74 |
| Tuesday | June 16 | 82 | 59 | 71 | -3 | 0.00 | 1.62 | 105 | 45 | 0 | 6 | 86 | 63 | 74 |
| Wednesday | June 17 | 87 | 67 | 77 | +3 | 0.00 | 1.82 | 101 | 44 | 0 | 12 | 86 | 63 | 74 |
| Thursday | June 18 | 82 | 59 | 71 | -4 | T | 1.78 | 105 | 50 | 0 | 6 | 86 | 63 | 75 |
| Friday | June 19 | 81 | 54 | 68 | -7 | 0.04 | 2.33 | 104 | 42 | 0 | 3 | 86 | 63 | 75 |
| Saturday | June 20 | 74 | 56 | 65 | -10 | 0.72 | 1.76 | 106 | 47 | 0 | 0 | 87 | 64 | 75 |
| Sunday | June 21 | 71 | 63 | 67 | -8 | 0.01 | 2.11 | 107 | 43 | 0 | 2 | 87 | 64 | 75 |
| Monday | June 22 | 77 | 56 | 67 | -9 | 0.00 | 2.40 | 102 | 49 | 0 | 2 | 87 | 64 | 76 |
| Tuesday | June 23 | 78 | 59 | 69 | -7 | T | 4.24 | 106 | 46 | 0 | 4 | 87 | 64 | 76 |
| Wednesday | June 24 | 84 | 62 | 73 | -3 | 0.07 | 4.59 | 103 | 47 | 0 | 8 | 87 | 64 | 76 |
| Thursday | June 25 | 71 | 63 | 67 | -9 | 0.01 | 3.00 | 103 | 42 | 0 | 2 | 88 | 65 | 76 |
| Friday | June 26 | 81 | 63 | 72 | -4 | 0.00 | 3.17 | 108 | 49 | 0 | 7 | 88 | 65 | 76 |
| Saturday | June 27 | 83 | 67 | 75 | -1 | 0.00 | 2.72 | 104 | 49 | 0 | 10 | 88 | 65 | 76 |
| Sunday | June 28 | 96 | 77 | 87 | +10 | 0.00 | 1.99 | 103 | 52 | 0 | 22 | 88 | 65 | 77 |
| Monday | June 29 | 95 | 78 | 87 | +10 | 0.00 | 2.86 | 104 | 44 | 0 | 22 | 88 | 65 | 77 |
| Tuesday | June 30 | 92 | 75 | 84 | +7 | 0.00 | 1.86 | 105 | 51 | 0 | . | 88 | 66 | 77 |
| June | 2026 | Max | Min | Mean | Dep | Pcpn | Rec Pcpn | Rec Max | Rec Min | HDD | CDD | Avg Max | Avg Min | Avg Mean |
| . | TOTAL | 4.09 | 0 | 262 | ||||||||||
| . | AVERAGE | 83.6 | 63.3 | 73.5 | . | . | ||||||||
| NORMAL | 85.2 | 62.1 | 73.7 | 4.48 | 12 | 271 | ||||||||
| . | DEPARTURE | -1.6 | +1.2 | -0.2 | -0.39 | -12 | -9 |
From the record books:
Warmest recorded JUNE temperature, 108°F, June 15, 1946 AND June 26, 1936.
Coldest recorded JUNE temperature, 39°F, June 8, 1978.
Wettest June: 12.93", 1967
Driest June: 0.17", 2002
AVERAGE AND TOTAL are JUNE 2026.
Temperature is °F
Precipitation measurement is "inches"
Precipitation "T" = trace, precipitation was observed but not enough to be measured
NORMAL (Norm) refers to the 1991-2020 Standard Normals.
DEPARTURE is JUNE 2026 Average measured against 1978-2010 normals.
Max = Observed Maximum and Min = Observed Minimum temperatures in °F
Mean = Observed Mean Daily temperature in °F.
Dep = Departure from normal ( - is below normal, + is above normal), in °F.
Pcpn = Observed daily precipitation (midnight to midnight, CST) in inches.
Rec Pcpn = Record daily amount of precipitation in inches.
Rec Max = Record maximum temperature in °F.
Rec Min = Record Minimum temperature in °F.
HDD = heating degree day units (base of 65 degrees) in °F.
CDD = cooling degree day units (base of 65 degrees) in °F.
Norm Max = Daily Normal High Temperature (1991-2020 normals) in °F.
Norm Min = Daily Normal Low Temperature (1991-2020 normals) in °F.
Norm Mean = Daily Normal Mean Temperature (1991-2020 normals) in °F
NOTE: All data on this page are from the National Weather Service and HPRCC data archives