Content
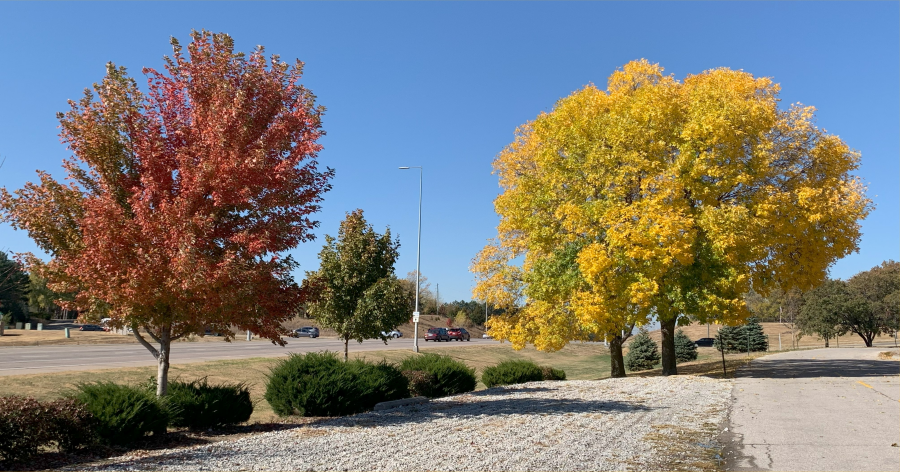
Fall colors in Lincoln: Photo by Ken Dewey.
NEW: Fall Colors 2025
Photo Gallery ONE AND Photo Gallery TWO AND Photo Gallery THREE
Last Month's Data, October 2025 Next Month's Data, December 2025
Our Social Media weather/climate updates
Twitter (X) AND Facebook AND Bluesky:
Progression of Fall Colors in the U.S.
October 1997 Lincoln Record snowfall
Year 2025 (and last year) Lincoln precipitation (inches), rain + melted snow
| JAN | FEB | MAR | APR | MAY | JUN | JUL | AUG | SEP | OCT | NOV | DEC | TOTAL | |
| Normal | 0.73 | 0.89 | 1.55 | 2.69 | 4.91 | 4.48 | 3.25 | 3.32 | 2.90 | 2.14 | 1.30 | 1.18 | 29.34 |
| 2025 | 0.10 | 0.31 | 0.95 | 1.71 | 3.05 | 3.22 | 3.93 | 4.89 | 3.53 | 1.94 | 0.61 | 24.24 | |
| 2024 | 0.95 | 0.51 | 1.09 | 3.42 | 4.78 | 3.28 | 7.23 | 1.50 | 0.20 | 1.08 | 3.85 | 0.61 | 28.50 |
Normal January 1 - October 31 Precipitation = 26.86 inches
Normal January 1 - November 30 Precipitation = 28.16 inches
SNOWFALL (inches): Winter 2025-26 (and last 4 Winters in inches) compared to normal.
November 2025 total is an estimate waiting for official amount
| OCT | NOV | DEC | JAN | FEB | MAR | APR | MAY | TOTAL | |
| Normal | 0.9 | 1.5 | 5.3 | 6.5 | 7.1 | 3.4 | 1.2 | 0.1 | 26.0 |
| 2025-26 | 0.0 | 3.7 | . | . | . | . | . | . | 3.7 |
| 2024-25 | 0.0 | T | T | 1.0 | 5.2 | 6.1 | 0.0 | 12.3 | |
| 2023-24 | T | 1.1 | 3.9 | 11.4 | T | T | 0.0 | 0.0 | 16.4 |
| 2022-23 | 0.0 | T | 1.6 | 2.0 | 9.5 | 1.2 | 0.0 | 0.0 | 14.3 |
| 2021-22 | 0.0 | T | 0.8 | 2.9 | 0.1 | 1.3 | T | 0.0 | 5.1 |
T = a Trace. Snowfall was observed but not enough to be measured
Lincoln's November 2025 Sun data
November 1: Sunrise 7:57 am; Sunset 6:22 pm, Daylight: 10 hours, 25 min
>>>>>NOTE: Standard Time begins (Daylight Saving ends} November 2.
November 2: Sunrise 6:58 am; Sunset 5:21 pm, Daylight: 10 hours, 22 min
November 30: Sunrise 7:30 am; Sunset 4:59 pm, Daylight: 9 hours, 29 min
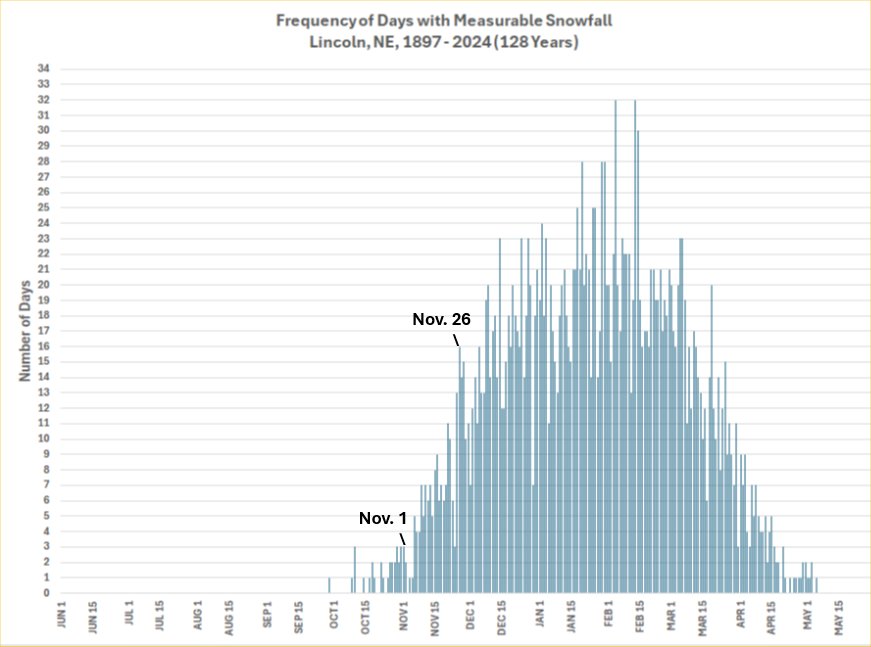
Lincoln's Earliest Snowfalls in Autumn
First freeze following Summer, 1887-2025
Growing season length, 1887 - 2024
Last freeze following Winter 1887-2025
RECORDS:
Record High November 14, 2025: 78°F, old record 75°F set in 1990
Record Warm daily Minimum November 24 2025: 47°F, old record 46°F set in 1915
All data in the following tables are from the National Weather Service and HPRCC data archives.
| November | 2025 | Max | Min | Mean | Dep | Pcpn | Rec Pcpn | Rec Max | Rec Min | HDD | CDD | Norm Max | Norm Min | Norm Mean | Snow |
|---|---|---|---|---|---|---|---|---|---|---|---|---|---|---|---|
| Saturday | Nov. 1 | 51 | 27 | 39 | -7 | 0.00 | 1.34 | 80 | 16 | 26 | 0 | 59 | 34 | 46 | . |
| Sunday | Nov. 2 | 62 | 26 | 44 | -2 | 0.00 | 0.79 | 81 | 9 | 21 | 0 | 58 | 34 | 46 | . |
| Monday | Nov. 3 | 64 | 33 | 49 | +4 | 0.00 | 2.05 | 83 | 1 | 16 | 0 | 58 | 33 | 45 | . |
| Tuesday | Nov. 4 | 71 | 36 | 54 | +9 | 0.00 | 0.97 | 80 | -4 | 11 | 0 | 57 | 33 | 45 | . |
| Wednesday | Nov. 5 | 59 | 30 | 45 | 0 | 0.00 | 1.20 | 81 | 15 | 20 | 0 | 57 | 32 | 45 | . |
| Thursday | Nov. 6 | 66 | 29 | 48 | +4 | 0.00 | 1.12 | 82 | 8 | 17 | 0 | 56 | 31 | 44 | . |
| Friday | Nov. 7 | 68 | 36 | 52 | +8 | 0.00 | 0.80 | 78 | 0 | 13 | 0 | 56 | 31 | 44 | . |
| Saturday | Nov. 8 | 54 | 33 | 44 | +1 | 0.06 | 1.55 | 84 | 3 | 21 | 0 | 55 | 31 | 43 | . |
| Sunday | Nov. 9 | 35 | 18 | 27 | -16 | 0.00 | 1.35 | 78 | 11 | 38 | 0 | 55 | 31 | 43 | . |
| Monday | Nov. 10 | 39 | 16 | 28 | -14. | 0.00 | 1.83 | 79 | 4 | 37 | 0 | 54 | 30 | 42 | . |
| Tuesday | Nov. 11 | 70 | 33 | 52 | _10 | 0.00 | 0.83 | 74 | -1 | 13 | 0 | 54 | 30 | 42 | . |
| Wednesday | Nov. 12 | 66 | 29 | 48 | +7 | 0.00 | 2.42 | 74 | 2 | 17 | 0 | 53 | 29 | 41 | . |
| Thursday | Nov. 13 | 74 | 33 | 54 | +13 | 0.00 | 1.98 | 85 | 0 | 11 | 0 | 53 | 29 | 41 | . |
| Friday | Nov. 14 | 78 | 34 | 56 | +16 | 0.00 | 1.71 | 78 | -1 | 9 | 0 | 52 | 29 | 40 | . |
| Saturday | Nov. 15 | 71 | 38 | 55 | +15 | 0.00 | 1.82 | 76 | 5 | 10 | 0 | 52 | 28 | 40 | . |
| Sunday | Nov. 16 | 58 | 29 | 44 | +4 | 0.00 | 2.06 | 80 | 4 | 21 | 0 | 51 | 28 | 40 | . |
| Monday | Nov. 17 | 59 | 41. | 50 | +11 | 0.13 | 1.44 | 75 | 5 | 15 | 0 | 51 | 27 | 39 | . |
| Tuesday | Nov. 18 | 48 | 35. | 42 | +3 | 0.00 | 1.72 | 78 | 4 | 23 | 0 | 51 | 27 | 39 | . |
| Wednesday | Nov. 19 | 54 | 34 | 44 | +6 | 0.00 | 2.06 | 78 | 4 | 21 | 0 | 50 | 27 | 38 | . |
| Thursday | Nov. 20 | 45 | 27 | 36 | -2 | 0.00 | 1.05 | 75 | 1 | 20 | 0 | 50 | 26 | 38 | . |
| Friday | Nov. 21 | 45 | 34 | 40 | +3 | 0.04 | 0.79 | 73 | 3 | 25 | 0 | 49 | 26 | 37 | . |
| Saturday | Nov. 22 | 65 | 31 | 48 | +11 | 0.00 | 0.74 | 68 | -1 | 17 | 0 | 49 | 25 | 37 | . |
| Sunday | Nov. 23 | 65 | 25 | 45 | +8 | 0.00 | 1.59 | 71 | -2 | 20 | 0 | 48 | 25 | 37 | . |
| Monday | Nov. 24 | 52 | 47 | 50 | +14 | 0.03 | 1.45 | 75 | 1 | 15 | 0 | 48 | 25 | 36 | . |
| Tuesday | Nov. 25 | 51 | 35 | 43 | +7 | T | 0.95 | 77 | 4 | 22 | 0 | 47 | 24 | 36 | T |
| Wednesday | Nov. 26 | 40 | 23 | 32 | -3 | 0.00 | 1.31 | 71 | -2 | 33 | 0 | 47 | 24 | 35 | . |
| Thursday | Nov. 27 | 41 | 16 | 29 | -6 | 0.00 | 1.25 | 72 | -15 | 36 | 0 | 46 | 24 | 35 | . |
| Friday | Nov. 28 | 29 | 16 | 23 | -12 | 0.01 | 0.63 | 65 | -3 | 42 | 0 | 46 | 23 | 35 | T |
| Saturday | Nov. 29 | 29 | 18 | 24 | -10 | 0.34 | 2.34 | 75 | -5 | 41 | 0 | 45 | 23 | 34 | 3.7 |
| Sunday | Nov. 30 | 21 | 15 | 18 | -16 | T | 1.37 | 71 | -5 | 47 | 0 | 45 | 22 | 34 | T |
| November | 2025 | Max | Min | Mean | Dep | Pcpn | Rec Pcpn | Rec Max | Rec Min | HDD | CDD | Avg Max | Avg Min | Avg Mean | |
| . | TOTAL | 0.61 | 687 | 0 | 3.7 | ||||||||||
| . | AVERAGE | 54.3 | 29.2 | 41.8 | |||||||||||
| November | NORMAL | 51.7 | 28.0 | 39.8 | 1.30 | 755 | 0 | 1.5 | |||||||
| DEPARTURE | +2.6 | +1.2 | +2.0 | -0.69 | -68 | 0 | +2.2 |
AVERAGE AND TOTAL are NOVEMBER 2025
Temperature is °F
Precipitation measurement is "inches"
Precipitation "T" = trace, precipitation was observed but not enough to be measured
NORMAL (Norm) refers to the 1991-2020 Standard Normals.
DEPARTURE is NOVEMBER 2025 Averages and totals measured against 1981-2010 Normals.
Max = Observed Maximum and Min = Observed Minimum temperatures °F.
Mean = Observed Mean Daily temperature °F.
Dep = Departure from normal ( - is below normal, + is above normal), °F.
Pcpn = Observed daily precipitation (midnight to midnight, CST) in inches.
Rec Pcpn = Record daily amount of precipitation in inches.
Rec Max = Record maximum temperature °F.
Rec Min = Record Minimum temperature °F.
HDD = heating degree day units (base of 65 degrees) °F.
CDD = cooling degree day units (base of 65 degrees) °F.
Norm Max = Daily Normal High Temperature (1991-2020 normals) °F.
Norm Min = Daily Normal Low Temperature (1991-2020 normals) °F.
Norm Mean = Daily Normal Mean Temperature (1991-2020 normals) °F.
Snow = Snowfall in inches.
From the record books:
Warmest recorded November temperature, 85°F, November 13, 1999.
Coldest recorded November temperature, -15°F, November 27, 1887.
Wettest November (rain + melted snow) = 7.14 inches, 1909
Driest November = 0.00 inches, 1894
NOVEMBER SNOWFALL CLIMATOLOGY
November, 128 years (1897-2024)
Novembers WITH measurable snowfall: 90 years (70.3% of the Novembers)
Novembers WITHOUT measurable snowfall: 38 years (29.7% of the Novembers)
WITHOUT MEASURABLE = 0.0 inches: 11 years since 1897; and a trace (T): 27 years since 1897.
A trace (T) of snowfall means snowfall was observed but not enough to be measured.
Most November Snowfall: 12.6 inches, 1957.
Least November Snowfall (1897-2024): (0.0 and T) 38 years
NOTE: All data on this page are from the National Weather Service and HPRCC data archives.