Content

November 1, 2024, Lincoln, NE: Rural Lincoln, NE.
A mild Autumn this year has resulted in the leaves remaining on the trees longer than normal.
Last Month's Data October 2024
Next Month's Data December 2024
Fall 2024 Colors in Lincoln Gallery One
Fall 2024 Colors in Lincoln Gallery Two
Climatology of first snowfall following Summer, 1897-2023
Lincoln's earliest snowfalls in the Autumn
Year 2024 (and last year) Lincoln Precipitation in Inches compared to normal
| JAN | FEB | MAR | APR | MAY | JUN | JUL | AUG | SEP | OCT | NOV | DEC | TOTAL | |
| Normal | 0.73 | 0.89 | 1.55 | 2.69 | 4.91 | 4.48 | 3.25 | 3.32 | 2.90 | 2.14 | 1.30 | 1.18 | 29.34 |
| 2024 | 0.95 | 0.51 | 1.09 | 3.42 | 4.78 | 3.28 | 7.23 | 1.50 | 0.20 | 1.08 | 2.13 | . | 26.17 |
| 2023 | 1.32 | 1.29 | 0.63 | 0.59 | 0.51 | 4.53 | 5.61 | 3.76 | 0.60 | 1.42 | 0.56 | 1.71 | 22.53 |
Normal January 1 - October 31 Precipitation = 26.86 inches
Normal January 1 - November 30 Precipitation = 28.16 inches
Winter 2024-25 (and last 4 Winters) Snowfall (in inches) compared to normal.
| OCT | NOV | DEC | JAN | FEB | MAR | APR | MAY | TOTAL | |
| Normal | 0.9 | 1.5 | 5.3 | 6.5 | 7.1 | 3.4 | 1.2 | 0.1 | 26.0 |
| 2024-25 | 0.0 | T | T | ||||||
| 2023-24 | T | 1.1 | 3.9 | 11.4 | T | T | 0.0 | .0.0 | 16.4 |
| 2022-23 | 0.0 | T | 1.6 | 2.0 | 9.5 | 1.2 | 0.0 | 0.0 | 14.3 |
| 2021-22 | 0.0 | T | 0.8 | 2.9 | 0.1 | 1.3 | T | 0.0 | 5.1 |
| 2020-21 | 2.9 | T | 11.0 | 18.9 | 16.6 | 0.0 | T | 0.0 | 49.4 |
T = a Trace. Snowfall was observed but not enough to be measured
Lincoln's November 2024 Sun data
November 1: Sunrise 7:57 am; Sunset 6:22 pm, Daylight: 10 hours, 25 min
November 30: Sunrise 7:51 am; Sunset 4:59 pm, Daylight: 9 hours, 28 min
Standard Time begins (Daylight Saving ends} November 3.
RECORD daily precipitation 1.72 inches, Nov. 18, 2024. Old record 0.68 inches, 1948.
All data in the following tables are from the National Weather Service and HPRCC data archives.
| November | 2024 | Max | Min | Mean | Dep | Pcpn | Rec Pcpn | Rec Max | Rec Min | HDD | CDD | Norm Max | Norm Min | Norm Mean | Snow |
|---|---|---|---|---|---|---|---|---|---|---|---|---|---|---|---|
| Friday | Nov. 1 | 65 | 31 | 48 | +2 | 0.00 | 1.34 | 80 | 16 | 17 | 0 | 59 | 34 | 46 | . |
| Saturday | Nov. 2 | 59 | 35 | 47 | +1 | 0.06 | 0.79 | 81 | 9 | 18 | 0 | 58 | 34 | 46 | . |
| Sunday | Nov. 3 | 71 | 54 | 63 | +18 | 0.55 | 2.05 | 83 | 1 | 2 | 0 | 58 | 33 | 45 | . |
| Monday | Nov. 4 | 63 | 49 | 56 | +11 | 0.44 | 0.97 | 80 | -4 | 9 | 0 | 57 | 33 | 45 | . |
| Tuesday | Nov. 5 | 55 | 37 | 46 | +1 | 0.30 | 1.20 | 81 | 15 | 19 | 0 | 57 | 32 | 45 | . |
| Wednesday | Nov. 6 | 58 | 33 | 46 | +2 | 0.00 | 1.12 | 82 | 8 | 19 | 0 | 56 | 31 | 44 | . |
| Thursday | Nov. 7 | 59 | 39 | 49 | +5 | 0.00 | 0.80 | 78 | 0 | 16 | 0 | 56 | 31 | 44 | . |
| Friday | Nov. 8 | 52 | 36 | 44 | +1 | 0.05 | 1.55 | 84 | 3 | 21 | 0 | 55 | 31 | 43 | . |
| Saturday | Nov. 9 | 61 | 48 | 55 | +12 | 0.48 | 1.35 | 78 | 11 | 10 | 0 | 55 | 31 | 43 | . |
| Sunday | Nov. 10 | 60 | 40 | 50 | +8 | 0.00 | 1.83 | 79 | 4 | 15 | 0 | 54 | 30 | 42 | . |
| Monday | Nov. 11 | 57 | 34 | 46 | +4 | 0.00 | 0.83 | 74 | -1 | 19 | 0 | 54 | 30 | 42 | . |
| Tuesday | Nov. 12 | 62 | 37 | 50 | +9 | 0.04 | 2.42 | 74 | 2 | 15 | 0 | 53 | 29 | 41 | . |
| Wednesday | Nov. 13 | 51 | 40 | 46 | +5 | 0.21 | 1.98 | 85 | 0 | 19 | 0 | 53 | 29 | 41 | . |
| Thursday | Nov. 14 | 63 | 31 | 47 | +7 | 0.00 | 1.71 | 75 | -1 | 18 | 0 | 52 | 29 | 40 | . |
| Friday | Nov. 15 | 70 | 29 | 50 | +10 | 0.00 | 1.82 | 76 | 5 | 15 | 0 | 52 | 28 | 40 | . |
| Saturday | Nov. 16 | 64 | 46 | 55 | +15 | T | 2.06 | 80 | 4 | 10 | 0 | 51 | 28 | 40 | . |
| Sunday | Nov. 17 | 57 | 32 | 45 | +6 | 0.00 | 1.44 | 75 | 5 | 20 | 0 | 51 | 27 | 39 | . |
| Monday | Nov. 18 | 63 | 37 | 50 | +11 | 1.72 | 1.72 | 78 | 4 | 15 | 0 | 51 | 27 | 39 | . |
| Tuesday | Nov. 19 | 54 | 39 | 47 | +9 | 0.00 | 2.06 | 78 | 4 | 18 | 0 | 50 | 27 | 38 | . |
| Wednesday | Nov. 20 | 52 | 36 | 44 | +6 | 0.00 | 1.05 | 75 | 1 | 21 | 0 | 50 | 26 | 38 | . |
| Thursday | Nov. 21 | 45 | 24 | 35 | -2 | 0.00 | 0.79 | 73 | 3 | 30 | 0 | 49 | 26 | 37 | . |
| Friday | Nov. 22 | 50 | 20 | 35 | -2 | 0.00 | 0.74 | 68 | -1 | 30 | 0 | 49 | 25 | 37 | . |
| Saturday | Nov. 23 | 62 | 28 | 45 | +9 | 0.00 | 1.59 | 71 | -2 | 20 | 0 | 48 | 25 | 37 | . |
| Sunday | Nov. 24 | 56 | 30 | 43 | +7 | 0.00 | 1.45 | 75 | 1 | 22 | 0 | 48 | 25 | 36 | . |
| Monday | Nov. 25 | 41 | 21 | 31 | -5 | 0.00 | 0.95 | 77 | 4 | 34 | 0 | 47 | 24 | 36 | . |
| Tuesday | Nov. 26 | 48 | 19 | 34 | -1 | 0.00 | 1.31 | 71 | -2 | 31 | 0 | 47 | 24 | 35 | . |
| Wednesday | Nov. 27 | 39 | 29 | 34 | -1 | 0.00 | 1.25 | 72 | -15 | 31 | 0 | 46 | 24 | 35 | . |
| Thursday | Nov. 28 | 39 | 20 | 30 | -4 | T | 0.63 | 65 | -3 | 35 | 0 | 46 | 23 | 35 | T |
| Friday | Nov. 29 | 32 | 12 | 22 | -12 | 0.00 | 2.34 | 75 | -5 | 43 | 0 | 45 | 23 | 34 | . |
| Saturday | Nov. 30 | 29 | 19 | 24 | -10 | 0.00 | 1.37 | 71 | -5 | 41 | 0 | 45 | 22 | 34 | . |
| November | 2024 | Max | Min | Mean | Dep | Pcpn | Rec Pcpn | Rec Max | Rec Min | HDD | CDD | Avg Max | Avg Min | Avg Mean | |
| . | TOTAL | 3.85 | 633 | 0 | T | ||||||||||
| . | AVERAGE | 54.6 | 32.8 | 43.7 | |||||||||||
| November | NORMAL | 51.7 | 28.0 | 39.8 | 1.30 | 755 | 0 | 1.5 | |||||||
| DEPARTURE | +2.9 | +4.8 | +3.9 | +2.55 | -122 | 0 | . |
AVERAGE AND TOTAL are NOVEMBER 2024
Temperature is °F
Precipitation measurement is "inches"
Precipitation "T" = trace, precipitation was observed but not enough to be measured
NORMAL (Norm) refers to the 1991-2020 Standard Normals.
DEPARTURE is NOVEMBER 2024 Averages and totals measured against 1981-2010 Normals.
Max = Observed Maximum and Min = Observed Minimum temperatures °F.
Mean = Observed Mean Daily temperature °F.
Dep = Departure from normal ( - is below normal, + is above normal), °F.
Pcpn = Observed daily precipitation (midnight to midnight, CST) in inches.
Rec Pcpn = Record daily amount of precipitation in inches.
Rec Max = Record maximum temperature °F.
Rec Min = Record Minimum temperature °F.
HDD = heating degree day units (base of 65 degrees) °F.
CDD = cooling degree day units (base of 65 degrees) °F.
Norm Max = Daily Normal High Temperature (1991-2020 normals) °F.
Norm Min = Daily Normal Low Temperature (1991-2020 normals) °F.
Norm Mean = Daily Normal Mean Temperature (1991-2020 normals) °F.
Snow = Snowfall in inches.
From the record books:
Warmest recorded November temperature, 85°F, November 13, 1999.
Coldest recorded November temperature, -15°F, November 27, 1887.
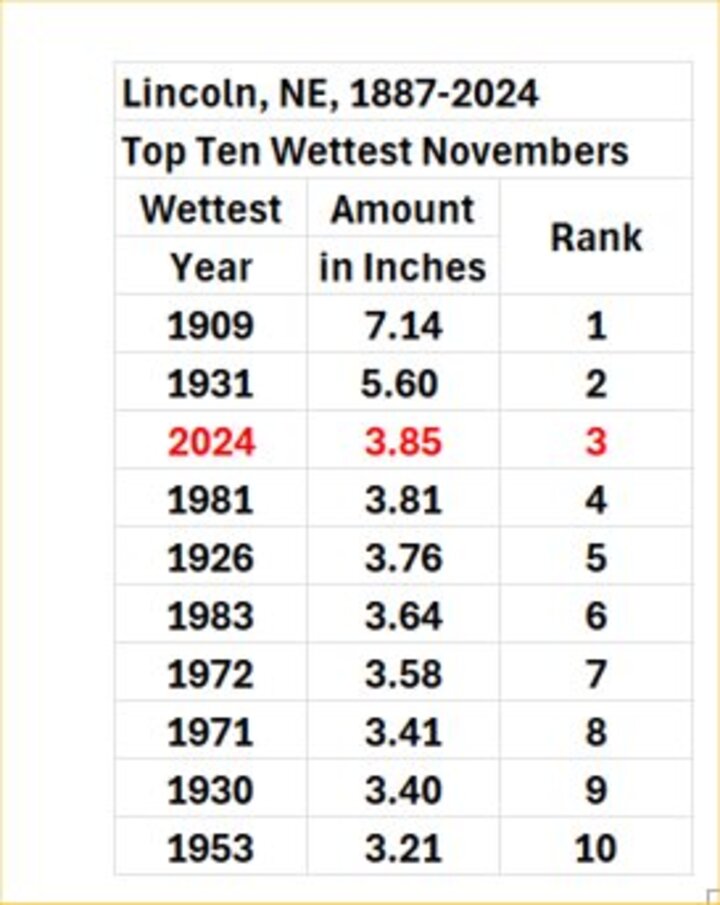
Wettest November = 7.14 inches, 1909
Driest November = 0.00 inches, 1894
November Snowfall Climatology
November, 127 years (1897-2023)
Novembers with measurable snowfall: 88 years (71% of the Novembers)
Novembers without measurable snowfall: 36 years (29% of the Novembers)
Most November Snowfall: 12.6 inches, 1957.
Least November Snowfall (1897-2023): (0.0 and T) 36 years
0.0 inches: 10 years since 1897; a trace (T): 26 years since 1897.
A trace (T) of snowfall means snowfall was observed but not enough to be measured.
NOTE: All data on this page are from the National Weather Service and HPRCC data archives.