Content
RETURN to the U.S. and Nebraska Tornado Page
Data Source: NWS Omaha
NOTE several graphs can be found below the table and they will be updated thru 2024 soon.
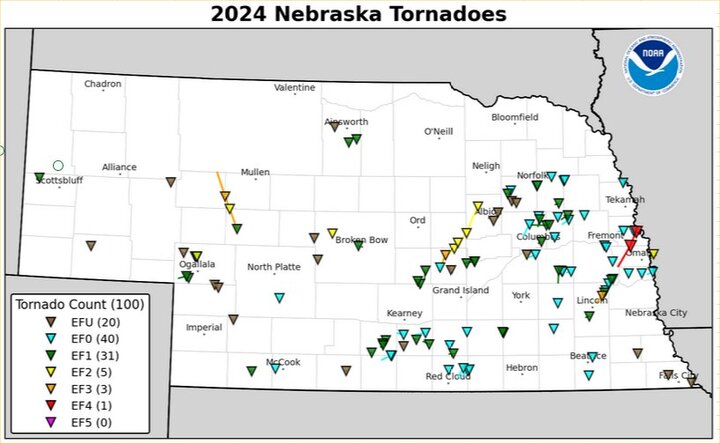
The monthly totals will be updated soon for 2024, but in the interim, the official total for 2024 is 100 tornadoes with only two years in the 1950-2024 data archive having more (2004 with 110 tornadoes and 1992 with 102 tornadoes).

The following table has a total of 101* tornadoes in 2024. There is a note by the NWS to me that there is a duplicate in the monthly totals and one of the monthly totals will be reduced by 1 tornado once I get that clarified
| YEAR | JAN | FEB | MAR | APR | MAY | JUN | JUL | AUG | SEP | OCT | NOV | DEC | YEAR | TOTAL |
| 2024 | 0 | 0 | 0 | 26 | 47 | 14 | 13 | 1 | 0 | 0 | 0 | 0 | 2024 | 101* |
| 2023 | 0 | 0 | 0 | 0 | 31 | 15 | 7 | 2 | 0 | 5 | 0 | 0 | 2023 | 60 |
| 2022 | 0 | 0 | 0 | 10 | 6 | 9 | 1 | 0 | 0 | 0 | 0 | 0 | 2022 | 26 |
| 2021 | 0 | 0 | 1 | 0 | 14 | 0 | 1 | 0 | 0 | 0 | 0 | 28 | 2021 | 44 |
| 2020 | 0 | 0 | 0 | 0 | 2 | 8 | 7 | 6 | 0 | 0 | 0 | 0 | 2020 | 23 |
| 2019 | 0 | 0 | 0 | 0 | 25 | 1 | 4 | 4 | 1 | 0 | 0 | 0 | 2019 | 35 |
| 2018 | 0 | 0 | 0 | 0 | 6 | 24 | 1 | 1 | 1 | 0 | 0 | 0 | 2018 | 33 |
| 2017 | 0 | 0 | 0 | 2 | 4 | 19 | 0 | 7 | 0 | 1 | 0 | 0 | 2017 | 33 |
| 2016 | 0 | 0 | 0 | 5 | 13 | 3 | 10 | 6 | 2 | 0 | 3 | 3 | 2016 | 45 |
| 2015 | 0 | 0 | 0 | 0 | 16 | 2 | 3 | 3 | 1 | 0 | 1 | 0 | 2015 | 26 |
| 2014 | 0 | 0 | 0 | 3 | 23 | 35 | 1 | 0 | 1 | 0 | 0 | 0 | 2014 | 63 |
| 2013 | 0 | 0 | 3 | 1 | 23 | 9 | 4 | 0 | 0 | 9 | 0 | 0 | 2013 | 49 |
| 2012 | 0 | 2 | 6 | 25 | 6 | 1 | 2 | 1 | 1 | 0 | 0 | 0 | 2012 | 44 |
| 2011 | 0 | 0 | 1 | 0 | 13 | 24 | 3 | 13 | 0 | 0 | 0 | 0 | 2011 | 54 |
| 2010 | 0 | 0 | 0 | 1 | 9 | 22 | 5 | 0 | 1 | 0 | 0 | 0 | 2010 | 38 |
| 2009 | 0 | 0 | 8 | 3 | 2 | 24 | 1 | 0 | 1 | 0 | 0 | 0 | 2009 | 39 |
| 2008 | 0 | 0 | 0 | 2 | 18 | 34 | 3 | 2 | 0 | 0 | 0 | 0 | 2008 | 59 |
| 2007 | 0 | 0 | 16 | 5 | 14 | 3 | 2 | 5 | 1 | 0 | 0 | 0 | 2007 | 46 |
| 2006 | 0 | 0 | 4 | 4 | 0 | 8 | 1 | 2 | 3 | 0 | 0 | 0 | 2006 | 22 |
| 2005 | 0 | 0 | 1 | 3 | 17 | 13 | 1 | 0 | 4 | 0 | 0 | 0 | 2005 | 39 |
| 2004 | 0 | 0 | 0 | 4 | 76 | 18 | 10 | 2 | 0 | 0 | 0 | 0 | 2004 | 110 |
| 2003 | 0 | 0 | 0 | 8 | 16 | 43 | 13 | 0 | 0 | 0 | 1 | 0 | 2003 | 81 |
| 2002 | 0 | 0 | 0 | 2 | 8 | 3 | 8 | 7 | 0 | 0 | 0 | 0 | 2002 | 28 |
| 2001 | 0 | 0 | 0 | 14 | 6 | 14 | 13 | 1 | 3 | 11 | 0 | 0 | 2001 | 62 |
| 2000 | 0 | 0 | 0 | 5 | 10 | 21 | 6 | 0 | 0 | 18 | 1 | 0 | 2000 | 61 |
| 1999 | 0 | 0 | 0 | 17 | 24 | 48 | 4 | 4 | 5 | 0 | 0 | 0 | 1999 | 102 |
| 1998 | 0 | 0 | 0 | 0 | 17 | 28 | 10 | 0 | 0 | 10 | 0 | 0 | 1998 | 65 |
| 1997 | 0 | 0 | 0 | 1 | 5 | 11 | 3 | 10 | 0 | 0 | 0 | 0 | 1997 | 30 |
| 1996 | 0 | 0 | 0 | 0 | 12 | 22 | 15 | 7 | 1 | 3 | 0 | 0 | 1996 | 60 |
| 1995 | 0 | 0 | 0 | 0 | 21 | 2 | 1 | 2 | 0 | 0 | 0 | 0 | 1995 | 26 |
| 1994 | 0 | 0 | 0 | 6 | 14 | 14 | 10 | 0 | 1 | 10 | 0 | 0 | 1994 | 55 |
| 1993 | 0 | 0 | 1 | 0 | 13 | 25 | 23 | 6 | 0 | 1 | 0 | 0 | 1993 | 69 |
| 1992 | 6 | 0 | 1 | 0 | 17 | 34 | 14 | 1 | 1 | 0 | 0 | 0 | 1992 | 74 |
| 1991 | 0 | 0 | 0 | 9 | 29 | 23 | 1 | 0 | 1 | 0 | 0 | 0 | 1991 | 63 |
| 1990 | 0 | 0 | 15 | 1 | 23 | 39 | 6 | 4 | 0 | 0 | 0 | 0 | 1990 | 88 |
| 1989 | 0 | 0 | 0 | 8 | 4 | 21 | 4 | 4 | 0 | 0 | 0 | 0 | 1989 | 41 |
| 1988 | 0 | 0 | 0 | 1 | 7 | 5 | 4 | 3 | 0 | 0 | 0 | 0 | 1988 | 20 |
| 1987 | 0 | 0 | 3 | 0 | 6 | 8 | 5 | 4 | 0 | 0 | 0 | 0 | 1987 | 26 |
| 1986 | 0 | 0 | 0 | 17 | 6 | 10 | 12 | 3 | 6 | 0 | 0 | 0 | 1986 | 54 |
| 1985 | 0 | 0 | 4 | 15 | 14 | 4 | 2 | 6 | 7 | 0 | 0 | 0 | 1985 | 52 |
| 1984 | 0 | 0 | 0 | 4 | 6 | 36 | 4 | 0 | 0 | 0 | 0 | 0 | 1984 | 50 |
| 1983 | 0 | 0 | 0 | 0 | 2 | 12 | 1 | 0 | 0 | 0 | 0 | 0 | 1983 | 15 |
| 1982 | 0 | 0 | 0 | 1 | 15 | 13 | 1 | 2 | 0 | 1 | 0 | 0 | 1982 | 33 |
| 1981 | 0 | 0 | 0 | 3 | 0 | 5 | 6 | 5 | 0 | 0 | 0 | 0 | 1981 | 19 |
| 1980 | 0 | 0 | 0 | 0 | 10 | 16 | 1 | 3 | 0 | 8 | 0 | 0 | 1980 | 38 |
| 1979 | 0 | 0 | 0 | 3 | 0 | 8 | 6 | 2 | 0 | 1 | 0 | 0 | 1979 | 20 |
| 1978 | 0 | 0 | 0 | 8 | 16 | 7 | 7 | 2 | 2 | 0 | 0 | 0 | 1978 | 42 |
| 1977 | 0 | 0 | 0 | 4 | 35 | 8 | 8 | 8 | 5 | 0 | 0 | 0 | 1977 | 68 |
| 1976 | 0 | 0 | 1 | 5 | 3 | 5 | 10 | 1 | 1 | 0 | 0 | 0 | 1976 | 26 |
| 1975 | 0 | 0 | 2 | 10 | 22 | 35 | 5 | 2 | 1 | 0 | 0 | 2 | 1975 | 79 |
| 1974 | 0 | 0 | 0 | 14 | 7 | 1 | 2 | 6 | 0 | 2 | 0 | 0 | 1974 | 32 |
| 1973 | 0 | 0 | 0 | 3 | 4 | 2 | 5 | 0 | 3 | 2 | 0 | 0 | 1973 | 19 |
| 1972 | 0 | 0 | 0 | 0 | 15 | 4 | 10 | 1 | 0 | 0 | 0 | 0 | 1972 | 30 |
| 1971 | 0 | 0 | 0 | 1 | 18 | 22 | 8 | 0 | 0 | 3 | 0 | 0 | 1971 | 52 |
| 1970 | 0 | 0 | 0 | 0 | 1 | 8 | 2 | 2 | 1 | 0 | 0 | 0 | 1970 | 14 |
| 1969 | 0 | 0 | 0 | 0 | 3 | 8 | 7 | 2 | 0 | 0 | 0 | 0 | 1969 | 20 |
| 1968 | 0 | 0 | 0 | 2 | 2 | 9 | 7 | 1 | 0 | 0 | 0 | 0 | 1968 | 21 |
| 1967 | 0 | 0 | 1 | 0 | 1 | 35 | 0 | 1 | 1 | 0 | 0 | 0 | 1967 | 39 |
| 1966 | 0 | 0 | 0 | 0 | 5 | 4 | 1 | 0 | 0 | 0 | 0 | 0 | 1966 | 10 |
| 1965 | 0 | 0 | 0 | 0 | 32 | 8 | 6 | 0 | 0 | 0 | 0 | 0 | 1965 | 46 |
| 1964 | 0 | 0 | 0 | 8 | 13 | 13 | 5 | 2 | 0 | 0 | 0 | 0 | 1964 | 41 |
| 1963 | 0 | 0 | 0 | 5 | 3 | 7 | 1 | 1 | 0 | 0 | 0 | 0 | 1963 | 17 |
| 1962 | 0 | 0 | 0 | 1 | 28 | 9 | 1 | 2 | 0 | 0 | 0 | 0 | 1962 | 41 |
| 1961 | 0 | 0 | 0 | 0 | 6 | 3 | 2 | 0 | 0 | 1 | 0 | 0 | 1961 | 12 |
| 1960 | 0 | 0 | 0 | 1 | 10 | 24 | 1 | 7 | 0 | 0 | 0 | 0 | 1960 | 43 |
| 1959 | 0 | 0 | 0 | 0 | 26 | 9 | 3 | 5 | 1 | 0 | 0 | 0 | 1959 | 44 |
| 1958 | 0 | 0 | 0 | 2 | 4 | 12 | 25 | 10 | 1 | 0 | 0 | 0 | 1958 | 54 |
| 1957 | 0 | 0 | 0 | 9 | 16 | 15 | 11 | 2 | 0 | 0 | 0 | 0 | 1957 | 53 |
| 1956 | 0 | 0 | 0 | 2 | 6 | 10 | 8 | 2 | 1 | 4 | 1 | 0 | 1956 | 34 |
| 1955 | 0 | 0 | 0 | 1 | 4 | 9 | 10 | 3 | 4 | 0 | 0 | 0 | 1955 | 31 |
| 1954 | 0 | 0 | 0 | 1 | 2 | 8 | 3 | 2 | 0 | 0 | 0 | 0 | 1954 | 16 |
| 1953 | 0 | 0 | 0 | 2 | 9 | 24 | 7 | 2 | 0 | 0 | 0 | 0 | 1953 | 44 |
| 1952 | 0 | 0 | 0 | 1 | 3 | 2 | 1 | 2 | 0 | 0 | 0 | 0 | 1952 | 9 |
| 1951 | 0 | 0 | 0 | 1 | 3 | 2 | 2 | 1 | 0 | 0 | 0 | 0 | 1951 | 9 |
| 1950 | 0 | 0 | 0 | 0 | 2 | 2 | 1 | 0 | 1 | 0 | 0 | 0 | 1950 | 6 |
| ALL YEARS | JAN | FEB | MAR | APR | MAY | JUN | JUL | AUG | SEP | OCT | NOV | DEC | ALL YEARS | |
| TOTAL thru 2023 | 6 | 2 | 68 | 254 | 865 | 1018 | 391 | 193 | 64 | 85 | 7 | 33 | 2986 | |
| TOTAL thru 2024 | 6 | 2 | 68 | 290 | 949 | 1056 | 412 | 196 | 64 | 90 | 7 | 33 | 3173 | |
| JAN | FEB | MAR | APR | MAY | JUN | JUL | AUG | SEP | OCT | NOV | DEC | ALL YEARS | ||
| MOST | 6 | 2 | 16 | 26 | 76 | 48 | 25 | 13 | 7 | 18 | 3 | 28 | 110 | |
| YEAR | 1992 | 2012 | 2007 | 2024 | 2004 | 1999 | 1958 | 2011 | 1985 | 2000 | 2016 | 2021 | 2004 | |
| Averages | ||||||||||||||
| 1950- 2024 | 0.1 | 0.0 | 0.9 | 3.9 | 12.7 | 14.1 | 5.6 | 2.6 | 0.9 | 1.2 | 0.1 | 0.4 | #1 | 42.3 |
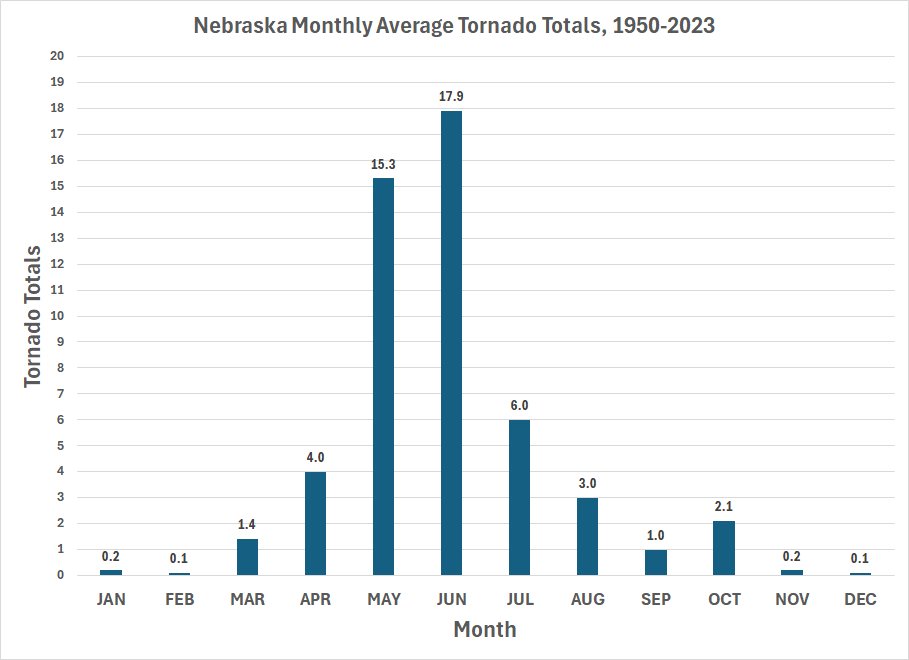
| 1991-2020 | 0.2 | 0.1 | 1.4 | 4.0 | 15.3 | 17.9 | 6.0 | 3.0 | 1.0 | 2.1 | 0.2 | 0.1 | #2 | 51.1 |
| 1981-2010 | 0.2 | 0.0 | 1.8 | 4.5 | 13.7 | 18.8 | 6.3 | 2.7 | 1.1 | 1.8 | 0.1 | 0.0 | #3 | 50.9 |
Why are there three different averages listed?
#1. The 1950-2024 is the average for the full 75 year data set. #2. The 1991-2020 average is the latest 30-year average time period. |
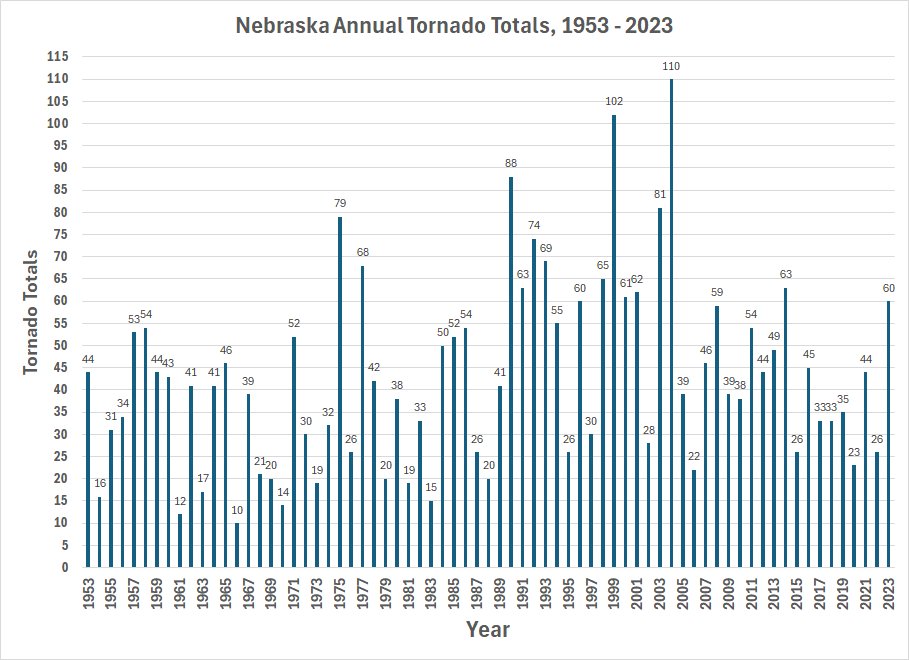
The following graphs will be updated soon


Nebraska annual totals 1950 (6); 1951 (9) and 1952 (9) are considered to be very under-counted.
A reliable reporting system was not instituted until 1953, so the above graph starts at 1953 not 1950.