Content
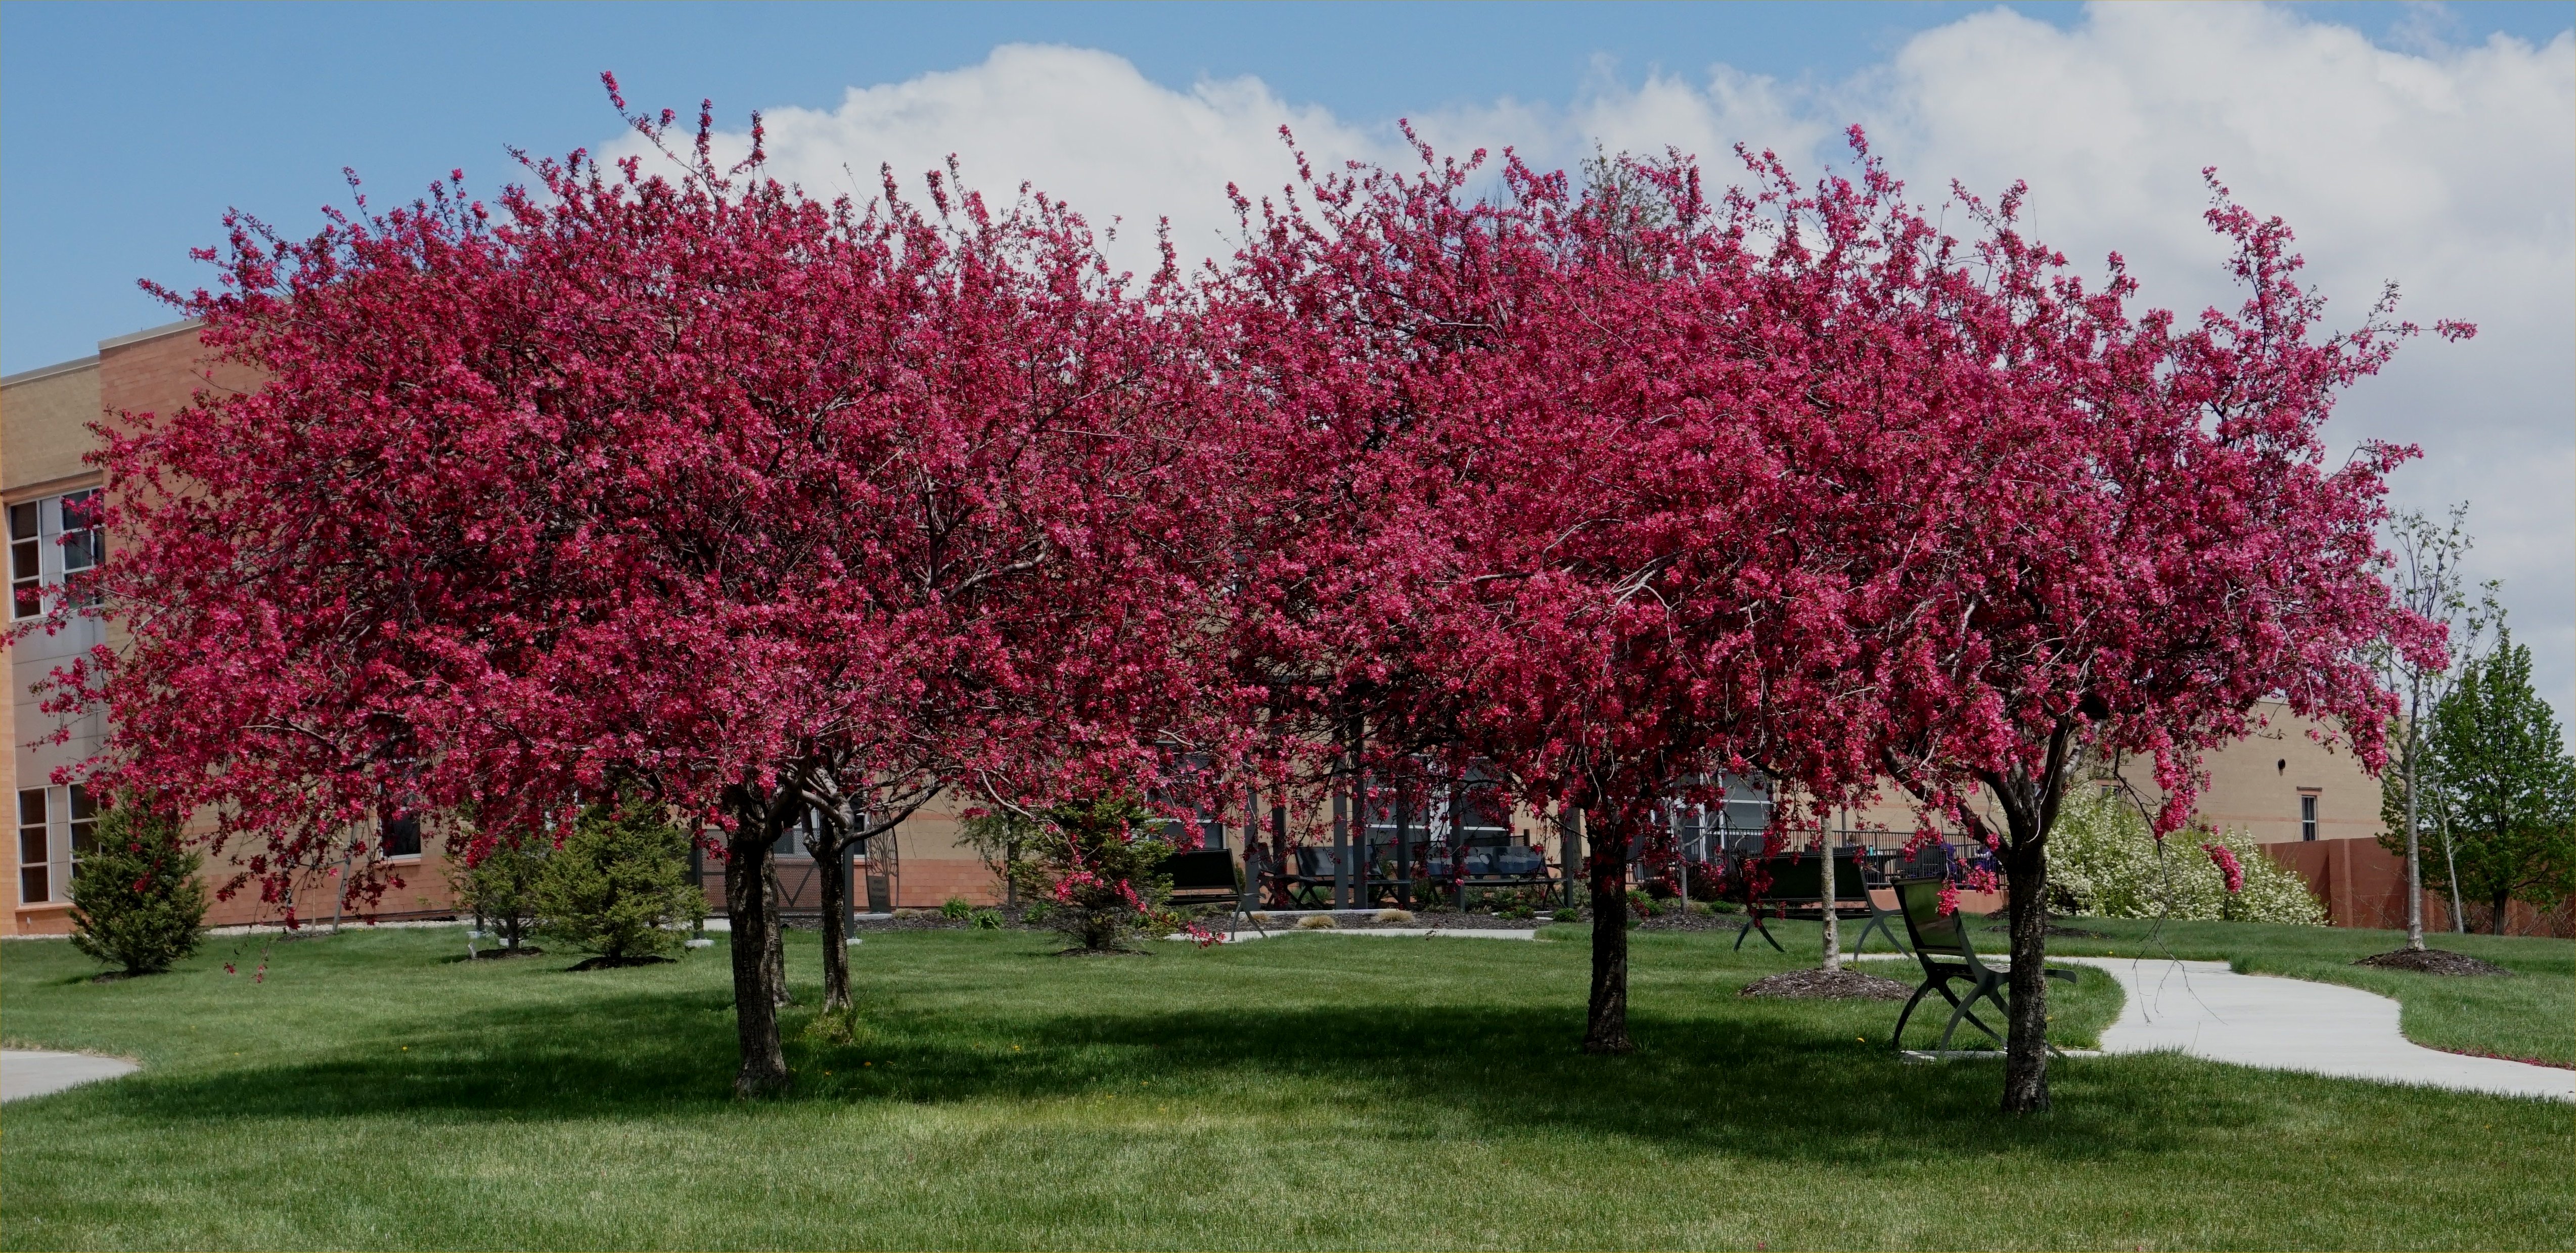
May 2021 begins with warm temperatures and a peak of Spring color in Lincoln, NE. Photo by Ken Dewey
Last Month's Data: April 2021 Next Month's Data: June 2021
Year 2021 (and last year) Lincoln Precipitation in Inches compared to normal
| JAN | FEB | MAR | APR | MAY | JUN | JUL | AUG | SEP | OCT | NOV | DEC | TOTAL | |
| Normal | 0.73 | 0.89 | 1.55 | 2.69 | 4.91 | 4.48 | 3.25 | 3.32 | 2.90 | 2.14 | 1.30 | 1.18 | 28.93 |
| 2021 | 1.53 | 0.79 | 5.23 | 1.74 | 2.51 | 11.84 | |||||||
| 2020 | 1.29 | 0.13 | 1.67 | 0.88 | 5.09 | 3.15 | 5.73 | 1.27 | 1.62 | 0.40 | 1.20 | 1.20 | 23.63 |
Normal January 1 - April 30 Precipitation total = 5.86 inches
Normal January 1 - May 31 Precipitation total = 10.77 inches
Lincoln's Hot Weather Climatology, LINK>> Heat Wave Climatology
All data in the following table are from the National Weather Service and HPRCC data archives.
NOTE: >> The NEW 1991-2020 Normals have been added to this page.
more information at: Lincoln's new 30-Year normals
If columns are hidden, scroll the table to the right.
| May | 2021 | Max | Min | Mean | Dep | Pcpn | Rec Pcpn | Rec Max | Rec Min | HDD | CDD | Norm Max | Norm Min | Norm Mean | Snow |
|---|---|---|---|---|---|---|---|---|---|---|---|---|---|---|---|
| Saturday | May 1 | 89 | 62 | 76 | +19 | 0.00 | 2.10 | 93 | 24 | 0 | 11 | 69 | 45 | 57 | |
| Sunday | May 2 | 85 | 62 | 74 | +16 | 0.08 | 1.50 | 91 | 26 | 0 | 9 | 70 | 45 | 58 | |
| Monday | May 3 | 67 | 51 | 59 | +1 | 0.32 | 1.90 | 91 | 25 | 6 | 0 | 70 | 46 | 58 | |
| Tuesday | May 4 | 66 | 40 | 53 | -5 | 0.00 | 2.47 | 91 | 30 | 12 | 0 | 71 | 46 | 58 | |
| Wednesday | May 5 | 66 | 32 | 49 | -10 | 0.06 | 3.35 | 97 | 31 | 16 | 0 | 71 | 47 | 59 | |
| Thursday | May 6 | 68 | 39 | 54 | -5 | 0.00 | 2.96 | 95 | 27 | 11 | 0 | 71 | 47 | 59 | |
| Friday | May 7 | 71 | 40 | 56 | -4 | 0.00 | 3.77 | 98 | 29 | 9 | 0 | 72 | 47 | 60 | |
| Saturday | May 8 | 69 | 45 | 57 | -3 | 0.29 | 1.96 | 95 | 29 | 8 | 0 | 72 | 48 | 60 | |
| Sunday | May 9 | 57 | 40 | 49 | -11 | 0.03 | 2.56 | 97 | 30 | 16 | 0 | 72 | 48 | 60 | |
| Monday | May 10 | 65 | 35 | 50 | -11 | 0.00 | 1.05 | 95 | 30 | 15 | 0 | 73 | 49 | 61 | |
| Tuesday | May 11 | 64 | 41 | 53 | -8 | 0.00 | 2.96 | 94 | 29 | 12 | 0 | 73 | 49 | 61 | |
| Wednesday | May 12 | 67 | 37 | 52 | -10 | 0.00 | 1.55 | 97 | 31 | 13 | 0 | 73 | 50 | 62 | |
| Thursday | May 13 | 72 | 43 | 58 | -4 | 0.00 | 2.76 | 96 | 27 | 7 | 0 | 74 | 50 | 62 | |
| Friday | May 14 | 71 | 54 | 63 | +1 | T | 2.63 | 100 | 32 | 2 | 0 | 74 | 50 | 62 | |
| Saturday | May 15 | 76 | 55 | 66 | +3 | T | 2.35 | 93 | 31 | 0 | 1 | 75 | 51 | 63 | |
| Sunday | May 16 | 64 | 59 | 62 | -1 | 0.29 | 2.01 | 92 | 30 | 3 | 0 | 75 | 51 | 63 | |
| Monday | May 17 | 72 | 59 | 66 | +2 | 0.01 | 2.01 | 93 | 33 | 0 | 1 | 75 | 52 | 64 | |
| Tuesday | May 18 | 74 | 62 | 68 | +4 | 0.07 | 2.41 | 94 | 34 | 0 | 3 | 76 | 52 | 64 | |
| Wednesday | May 19 | 75 | 63 | 69 | +5 | 0.11 | 1.62 | 95 | 35 | 0 | 4 | 76 | 53 | 64 | |
| Thursday | May 20 | 74 | 63 | 69 | +4 | T | 2.64 | 95 | 33 | 0 | 4 | 77 | 53 | 65 | |
| Friday | May 21 | 85 | 66 | 76 | +11 | 0.00 | 1.56 | 95 | 36 | 0 | 11 | 77 | 53 | 65 | |
| Saturday | May 22 | 86 | 67 | 77 | +11 | 0.04 | 2.43 | 96 | 36 | 0 | 12 | 77 | 54 | 66 | |
| Sunday | May 23 | 86 | 65 | 76 | +10 | 0.00 | 1.45 | 94 | 39 | 0 | 11 | 78 | 54 | 66 | |
| Monday | May 24 | 83 | 63 | 73 | +7 | 0.05 | 1.43 | 100 | 34 | 0 | 8 | 78 | 55 | 66 | |
| Tuesday | May 25 | 86 | 61 | 74 | +7 | T | 1.78 | 98 | 35 | 0 | 9 | 79 | 55 | 67 | |
| Wednesday | May 26 | 86 | 53 | 70 | +3 | 0.22 | 2.43 | 100 | 38 | 0 | 5 | 79 | 55 | 67 | |
| Thursday | May 27 | 75 | 52 | 64 | -4 | 0.94 | 3.32 | 97 | 36 | 1 | 0 | 79 | 56 | 68 | |
| Friday | May 28 | 55 | 48 | 52 | -16 | 0.00 | 1.97 | 98 | 34 | 13 | 0 | 80 | 56 | 68 | |
| Saturday | May 29 | 67 | 48 | 58 | -10 | 0.00 | 2.64 | 102 | 32 | 7 | 0 | 80 | 57 | 68 | |
| Sunday | May 30 | 65 | 50 | 58 | -11 | 0.04 | 2.59 | 104 | 40 | 7 | 0 | 80 | 57 | 69 | |
| Monday | May 31 | 77 | 51 | 64 | -5 | 0.00 | 2.05 | 103 | 41 | 1 | 0 | 81 | 57 | 69 | |
| May | 2021 | Max | Min | Mean | Dep | Pcpn | Rec Pcpn | Rec Max | Rec Min | HDD | CDD | Avg Max | Avg Min | Avg Mean | |
| . | TOTAL | 2.55 | 159 | 89 | . | ||||||||||
| . | AVERAGE | 73.0 | 51.8 | 62.4 | |||||||||||
| NORMAL | 75.0 | 51.2 | 63.1 | 4.91 | 143 | 84 | |||||||||
| . | DEPARTURE | -2.0 | +0.6 | -0.7 | -2.36 | +16 | +5 |
AVERAGE AND TOTAL are MAY 2021.
Temperature is °F
Precipitation measurement is "inches"
Precipitation "T" = trace, precipitation was observed but not enough to be measured
NORMAL (Norm) refers to the 1991-2020 Standard Normals
DEPARTURE is MAY 2021 Average measured against 1991-2020 normals, in °F.
Max = Observed Maximum and Min = Observed Minimum temperatures in °F.
Mean = Observed Mean Daily temperature in °F.
Dep = Departure from normal ( __ = below normal, + above normal), in °F.
Pcpn = Observed daily precipitation (midnight to midnight, CST) in inches.
Rec Pcpn = Record daily amount of precipitation in inches.
Rec Max = Record maximum temperature in °F.
Rec Min = Record Minimum temperature in °F.
HDD = heating degree day units (base of 65 degrees) in °F.
CDD = cooling degree day units (base of 65 degrees) in °F.
Norm Max = Daily Normal High Temperature (1991-2020 normals) in °F.
Norm Min = Daily Normal Low Temperature (1991-2020 normals) in °F.
Norm Mean = Daily Normal Mean Temperature (1991-2020 normals) in °F.
From the record books:
Warmest recorded MAY temperature, 104 °F., May 30, 1934.
Coldest recorded MAY temperature, 24 °F, May 1, 1994.
May Snowfalls:
Most MAY Snowfall: 3.0 inches, May 3-4, 1967.
Measurable snowfall has occurred 3 times in May from 1900 - 2020
May 3, 1907: 2.2 inches
May 3-4, 1967: 3.0 inches
May 1-2, 2013: 2.7 inches
NOTE: All data on this page are from the National Weather Service and HPRCC data archives.