Content
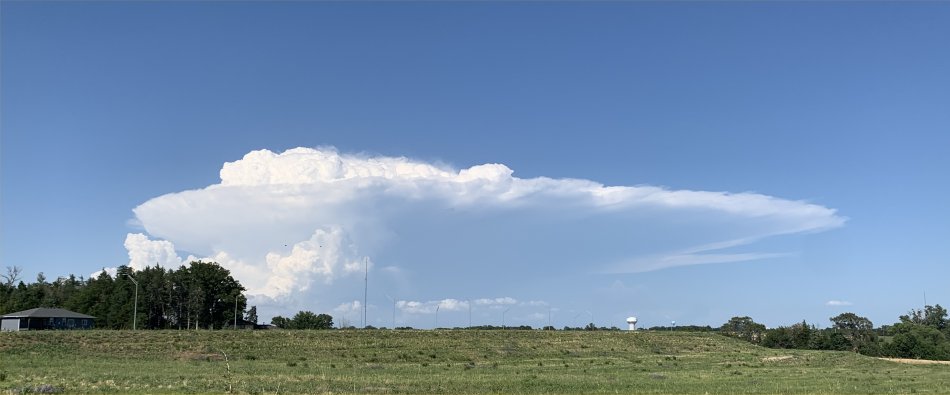
A June thunderstorm just to the East of Lincoln, NE
Last Month's Data (May 2025) Next Month's Data (July 2025)
Year 2025 (and last year) Lincoln precipitation (inches), rain + melted snow
| JAN | FEB | MAR | APR | MAY | JUN | JUL | AUG | SEP | OCT | NOV | DEC | TOTAL | |
| Normal | 0.73 | 0.89 | 1.55 | 2.69 | 4.91 | 4.48 | 3.25 | 3.32 | 2.90 | 2.14 | 1.30 | 1.18 | 29.34 |
| 2025 | 0.10 | 0.31 | 0.95 | 1.71 | 3.05 | 3.22 | 9.34 | ||||||
| 2024 | 0.95 | 0.51 | 1.09 | 3.42 | 4.78 | 3.28 | 7.23 | 1.50 | 0.20 | 1.08 | 3.85 | 0.61 | 28.50 |
Normal January 1 - June 30 Precipitation total = 15.25 inches
NOTE: Lincoln's Hot Weather Climatology, LINK>> Hot weather climatology
April 2025 Spring Colors Gallery Two
April 2025 Spring Colors Gallery One
April 17, 2025 Tornadoes and hail near Lincoln and Omaha
Storm Spotter Training
June 3, 1980 Grand Island, NE, Tornadoes
50th Anniversary Omaha May 6, 1975 Tornado (NWS)
50th Anniversary Omaha May 6, 1975 Tornado (Central Nebraska Today)
List of all Daily Records and years set
Record warm daily low temperature 81°F, June 21, 2025 (old record 79°F set in 1974)
Record warm daily low temperature 79°F, June 22, 2025 (old record 77°F set in 1988)
Daily FACEBOOK Weather Forecast Updates
Daily TWITTER Weather Forecast Updates
Daily BlueSky Forecast Updates

Great Plains Weather book available at Nebraska Press
Great Plains Weather Book Review Comments
June 2025 Daylight:
June 1: Sunrise 5:57am; Sunset 8:52pm (Daylight 14hr 55min)
June 21: Summer Solstice (Greatest Daylight): Daylight 15hr 06min
June 30: Sunrise 5:58am; Sunset 9:02pm (Daylight 15hr 04min)
All data in the following table are from the National Weather Service and HPRCC data archives.
| June | 2025 | Max | Min | Mean | Dep | Pcpn | Rec Pcpn | Rec Max | Rec Min | HDD | CDD | Norm Max | Norm Min | Norm Mean |
|---|---|---|---|---|---|---|---|---|---|---|---|---|---|---|
| Sunday | June 1 | 87 | 54 | 71 | +2 | 0.00 | 3.02 | 96 | 40 | 0 | 6 | 81 | 58 | 69 |
| Monday | June 2 | 90 | 58 | 74 | +4 | 0.15 | 2.00 | 100 | 43 | 0 | 9 | 81 | 58 | 70 |
| Tuesday | June 3 | 74 | 51 | 63 | -7 | 0.70 | 2.44 | 97 | 40 | 2 | 0 | 82 | 58 | 70 |
| Wednesday | June 4 | 77 | 46 | 62 | -8 | 0.00 | 2.64 | 100 | 40 | 3 | 0 | 82 | 59 | 70 |
| Thursday | June 5 | 71 | 55 | 63 | -8 | 0.02 | 4.08 | 101 | 42 | 2 | 0 | 82 | 59 | 71 |
| Friday | June 6 | 78 | 59 | 69 | -2 | 0.08 | 1.72 | 107 | 44 | 0 | 4 | 83 | 60 | 71 |
| Saturday | June 7 | 81 | 63 | 72 | +1 | 0.22 | 3.30 | 100 | 41 | 0 | 7 | 83 | 60 | 71 |
| Sunday | June 8 | 70 | 58 | 64 | -8 | 0.04 | 2.92 | 102 | 39 | 1 | 0 | 83 | 60 | 72 |
| Monday | June 9 | 78 | 54 | 66 | -6 | 0.00 | 1.90 | 101 | 44 | 1 | 0 | 84 | 61 | 72 |
| Tuesday | June 10 | 89 | 51 | 70 | -2 | 0.00 | 2.02 | 106 | 43 | 5 | 0 | 84 | 61 | 72 |
| Wednesday | June 11 | 94 | 63 | 79 | +6 | 0.00 | 3.03 | 103 | 44 | 0 | 14 | 84 | 61 | 73 |
| Thursday | June 12 | 88 | 61 | 75 | +2 | 0.00 | 3.72 | 101 | 43 | 0 | 10 | 85 | 61 | 73 |
| Friday | June 13 | 87 | 62 | 75 | +2 | 0.00 | 1.88 | 102 | 43 | 0 | 10 | 85 | 62 | 73 |
| Saturday | June 14 | 90 | 63 | 77 | +3 | 0.00 | 3.75 | 101 | 44 | 0 | 12 | 85 | 62 | 74 |
| Sunday | June 15 | 92 | 68 | 80 | +6 | 0.00 | 2.88 | 108 | 44 | 0 | 15 | 85 | 62 | 74 |
| Monday | June 16 | 93 | 68 | 81 | +7 | 0.33 | 1.62 | 105 | 45 | 0 | 16 | 86 | 63 | 74 |
| Tuesday | June 17 | 83 | 66 | 75 | +1 | 0.22 | 1.82 | 101 | 44 | 0 | 10 | 86 | 63 | 74 |
| Wednesday | June 18 | 82 | 63 | 73 | -2 | 0.03 | 1.78 | 105 | 50 | 0 | 8 | 86 | 63 | 75 |
| Thursday | June 19 | 93 | 60 | 77 | +2 | 0.00 | 2.33 | 104 | 42 | 0 | 12 | 86 | 63 | 75 |
| Friday | June 20 | 102 | 76 | 89 | +14 | 0.00 | 1.76 | 106 | 47 | 0 | 24 | 87 | 64 | 75 |
| Saturday | June 21 | 100 | 81 | 91 | +16 | 0.00 | 2.11 | 107 | 43 | 0 | 26 | 87 | 64 | 75 |
| Sunday | June 22 | 97 | 79 | 88 | +12 | 0.00 | 2.40 | 102 | 49 | 0 | 23 | 87 | 64 | 76 |
| Monday | June 23 | 90 | 71 | 81 | +5 | 0.18 | 4.24 | 106 | 46 | 0 | 16 | 87 | 64 | 76 |
| Tuesday | June 24 | 83 | 72 | 78 | +2 | 0.29 | 4.59 | 103 | 47 | 0 | 13 | 87 | 64 | 76 |
| Wednesday | June 25 | 93 | 72 | 83 | +7 | 0.49 | 3.00 | 103 | 42 | 0 | 18 | 88 | 65 | 76 |
| Thursday | June 26 | 89 | 70 | 80 | +4 | 0.01 | 3.17 | 108 | 49 | 0 | 15 | 88 | 65 | 76 |
| Friday | June 27 | 91 | 65 | 78 | +2 | 0.00 | 2.72 | 104 | 49 | 0 | 13 | 88 | 65 | 76 |
| Saturday | June 28 | 93 | 71 | 82 | +5 | 0.00 | 1.99 | 103 | 52 | 0 | 17 | 88 | 65 | 77 |
| Sunday | June 29 | 85 | 67 | 76 | -1 | 0.35 | 2.86 | 104 | 44 | 0 | 11 | 88 | 65 | 77 |
| Monday | June 30 | 87 | 62 | 75 | -2 | 0.11 | 1.86 | 105 | 51 | 0 | . | 88 | 66 | 77 |
| June | 2025 | Max | Min | Mean | Dep | Pcpn | Rec Pcpn | Rec Max | Rec Min | HDD | CDD | Avg Max | Avg Min | Avg Mean |
| . | TOTAL | 3.22 | 8 | 325 | ||||||||||
| as of . | AVERAGE | 86.9 | 63.6 | 75.3 | . | . | ||||||||
| NORMAL | 85.2 | 62.1 | 73.7 | 4.48 | 12 | 271 | ||||||||
| . | DEPARTURE | +1.7 | +1.5 | +1.6 | -1.26 | -4 | +54 |
From the record books:
Warmest recorded JUNE temperature, 108°F, June 15, 1946 AND June 26, 1936.
Coldest recorded JUNE temperature, 39°F, June 8, 1978.
Wettest June: 12.93", 1967
Driest June: 0.17", 2002
AVERAGE AND TOTAL are JUNE 2025.
Temperature is °F
Precipitation measurement is "inches"
Precipitation "T" = trace, precipitation was observed but not enough to be measured
NORMAL (Norm) refers to the 1991-2020 Standard Normals.
DEPARTURE is JUNE 2025 Average measured against 1978-2010 normals.
Max = Observed Maximum and Min = Observed Minimum temperatures in °F
Mean = Observed Mean Daily temperature in °F.
Dep = Departure from normal ( - is below normal, + is above normal), in °F.
Pcpn = Observed daily precipitation (midnight to midnight, CST) in inches.
Rec Pcpn = Record daily amount of precipitation in inches.
Rec Max = Record maximum temperature in °F.
Rec Min = Record Minimum temperature in °F.
HDD = heating degree day units (base of 65 degrees) in °F.
CDD = cooling degree day units (base of 65 degrees) in °F.
Norm Max = Daily Normal High Temperature (1991-2020 normals) in °F.
Norm Min = Daily Normal Low Temperature (1991-2020 normals) in °F.
Norm Mean = Daily Normal Mean Temperature (1991-2020 normals) in °F
NOTE: All data on this page are from the National Weather Service and HPRCC data archives