Content
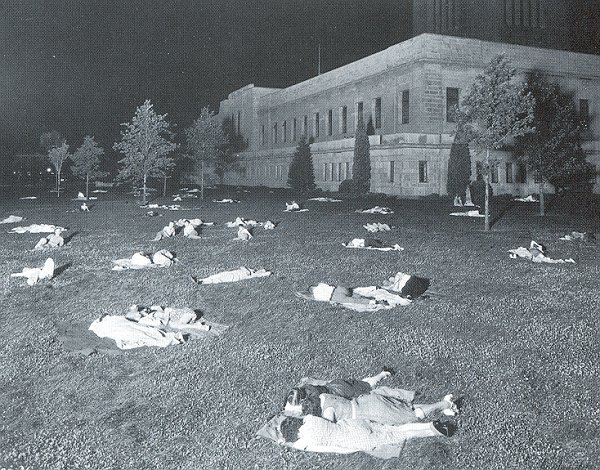
July 25, 1936: With an overnight low of only 91°F after a daytime high of 115°F,
residents of Lincoln, NE, spent the night on the capitol lawn to escape the heat
inside their homes and apartments. (Photo courtesy: Nebraska Historical Society).
Last Month's Data (June 2025)
Next Month's Data (August 2025)
Lincoln's Hot Weather Climatology>> Hot weather climatology

Great Plains Weather book available at Nebraska Press
Great Plains Weather Book Review Comments

Link: Photo Gallery June 2025 UNL National Weather Camp
PRECIPITATION TABLE
Year 2025 (and last year) Lincoln precipitation (inches), rain + melted snow
| JAN | FEB | MAR | APR | MAY | JUN | JUL | AUG | SEP | OCT | NOV | DEC | TOTAL | |
| Normal | 0.73 | 0.89 | 1.55 | 2.69 | 4.91 | 4.48 | 3.25 | 3.32 | 2.90 | 2.14 | 1.30 | 1.18 | 29.34 |
| 2025 | 0.10 | 0.31 | 0.95 | 1.71 | 3.05 | 3.22 | 3.93 | 13.27 | |||||
| 2024 | 0.95 | 0.51 | 1.09 | 3.42 | 4.78 | 3.28 | 7.23 | 1.50 | 0.20 | 1.08 | 3.85 | 0.61 | 28.50 |
Normal January 1 - June 30 Precipitation total = 15.25 inches
Normal January 1 - July 31 Precipitation total = 18.50 inches
July 2025 Daylight:
July 1: Sunrise 5:59am; Sunset 9:01pm (Daylight 15hr 02min)
July 31: Sunrise 6:22am; Sunset 8:42pm (Daylight 14hr 20min)
All data in the following table are from the National Weather Service and HPRCC data archives.
| July | 2025 | Max | Min | Mean | Dep | Pcpn | Rec Pcpn | Rec Max | Rec Min | HDD | CDD | Norm Max | Norm Min | Norm Mean |
|---|---|---|---|---|---|---|---|---|---|---|---|---|---|---|
| Tuesday | July 1 | 87 | 58 | 73 | -4 | 0.00 | 4.86 | 108 | 45 | 0 | 8 | 89 | 66 | 77 |
| Wednesday | July 2 | 94 | 65 | 80 | +3 | 0.52 | 1.24 | 108 | 50 | 0 | 15 | 89 | 66 | 77 |
| Thursday | July 3 | 92 | 69 | 81 | +4 | 0.00 | 1.20 | 108 | 49 | 0 | 16 | 89 | 66 | 77 |
| Friday | July 4 | 90 | 70 | 80 | +2 | T | 2.44 | 110 | 47 | 0 | 15 | 89 | 66 | 78 |
| Saturday | July 5 | 91 | 72 | 82 | +4 | 0.48 | 3.17 | 110 | 49 | 0 | 17 | 89 | 66 | 78 |
| Sunday | July 6 | 89 | 68 | 79 | +1 | 0.03 | 2.61 | 105 | 49 | 0 | 14 | 89 | 66 | 78 |
| Monday | July 7 | 91 | 66 | 79 | +1 | 0.18 | 3.01 | 104 | 49 | 0 | 14 | 89 | 66 | 78 |
| Tuesday | July 8 | 88 | 65 | 77 | -1 | 0.58 | 3.19 | 102 | 50 | 0 | 12 | 89 | 67 | 78 |
| Wednesday | July 9 | 91 | 66 | 79 | +1 | 0.00 | 2.14 | 104 | 49 | 0 | 14 | 89 | 67 | 78 |
| Thursday | July 10 | 92 | 70 | 81 | +3 | 0.06 | 2.40 | 103 | 48 | 0 | 16 | 89 | 67 | 78 |
| Friday | July 11 | 82 | 68 | 75 | -3 | T | 2.97 | 107 | 51 | 0 | 10 | 90 | 67 | 78 |
| Saturday | July 12 | 79 | 59 | 69 | -9 | 0.00 | 1.94 | 111 | 52 | 0 | 4 | 90 | 67 | 78 |
| Sunday | July 13 | 87 | 55 | 71 | -7 | 0.00 | 1.26 | 108 | 50 | 0 | 6 | 90 | 67 | 78 |
| Monday | July 14 | 94 | 66 | 80 | +2 | 0.00 | 1.15 | 107 | 49 | 0 | 15 | 90 | 67 | 78 |
| Tuesday | July 15 | 94 | 66 | 80 | +2 | 0.31 | 2.04 | 112 | 51 | 0 | 15 | 90 | 67 | 78 |
| Wednesday | July 16 | 81 | 66 | 74 | -4 | 0.41 | 1.56 | 109 | 48 | 0 | 9 | 90 | 67 | 78 |
| Thursday | July 17 | 76 | 61 | 69 | -9 | 0.00 | 1.55 | 112 | 49 | 0 | 4 | 90 | 67 | 78 |
| Friday | July 18 | 87 | 65 | 76 | -2 | 0.00 | 2.56 | 108 | 50 | 0 | 11 | 90 | 67 | 78 |
| Saturday | July 19 | 91 | 73 | 82 | +4 | 0.01 | 2.47 | 111 | 51 | 0 | 17 | 90 | 67 | 78 |
| Sunday | July 20 | 91 | 70 | 81 | +3_ | T | 1.77 | 110 | 54 | 0 | 16 | 90 | 67 | 78 |
| Monday | July 21 | 86 | 72 | 79 | +1 | 0.00 | 3.26 | 107 | 50 | 0 | 14 | 90 | 67 | 78 |
| Tuesday | July 22 | 89 | 72 | 81 | +3 | T | 1.47 | 105 | 53 | 0 | 16 | 90 | 67 | 78 |
| Wednesday | July 23 | 93 | 69 | 81 | +3 | 0.45 | 2.77 | 106 | 48 | 0 | 16 | 90 | 67 | 78 |
| Thursday | July 24 | 83 | 69 | 76 | -2 | 0.13 | 3.07 | 111 | 52 | 0 | 11 | 90 | 67 | 78 |
| Friday | July 25 | 83 | 69 | 76 | -2 | 0.01 | 5.42 | 115 | 51 | 0 | 11 | 90 | 67 | 78 |
| Saturday | July 26 | 91 | 71 | 81 | +3 | T | 2.91 | 109 | 49 | 0 | 16 | 90 | 67 | 78 |
| Sunday | July 27 | 96 | 70 | 83 | +5 | 0.00 | 1.32 | 108 | 50 | 0 | 18 | 90 | 67 | 78 |
| Monday | July 28 | 97 | 74 | 86 | +8 | 0.00 | 1.97 | 106 | 47 | 0 | 21 | 89 | 67 | 78 |
| Tuesday | July 29 | 98 | 71 | 85 | +7 | 0.07 | 1.92 | 105 | 49 | 0 | 20 | 89 | 67 | 78 |
| Wednesday | July 30 | 79 | 69 | 74 | -4 | 0.56 | 1.58 | 106 | 46 | 0 | 9 | 89 | 67 | 78 |
| Thursday | July 31 | 80 | 65 | 73 | -5 | 0.13 | 1.28 | 105 | 50 | 0 | 8 | 89 | 67 | 78 |
| July | 2025 | Max | Min | Mean | Dep | Pcpn | Rec Pcpn | Rec Max | Rec Min | HDD | CDD | Avg Max | Avg Min | Avg Mean |
| . | TOTAL | 3.93 | 0 | 408 | ||||||||||
| . | AVERAGE | 88.5 | 67.4 | 77.9 | ||||||||||
| NORMAL | 89.4 | 66.7 | 78.1 | 3.25 | 1 | 405 | ||||||||
| . | DEPARTURE | -0.9 | +0.7 | -0.2 | +0.68 | -1 | +3 |
AVERAGE AND TOTAL are July 2025.
NORMAL (Norm) is the 1991-2020 "Standard Normals".
Temperature is °F
Precipitation measurement is "inches"
Precipitation "T" = trace, precipitation was observed but not enough to be measured
NORMAL (Norm) refers to the 1991-2020 "Standard Normals".
DEPARTURE is July 2025 Average measured against 1991-2020 normals.
Max = Observed Maximum and Min = Observed Minimum temperatures in °F
Mean = Observed Mean Daily temperature in °F
Dep = Departure from normal ( - is below normal, + is above normal), in °F
Pcpn = Observed daily precipitation (midnight to midnight, CST) in inches.
Rec Pcpn = Record daily amount of precipitation in inches.
Rec Max = Record maximum temperature in °F
Rec Min = Record minimum temperature in °F
HDD = heating degree day units (base of 65 degrees) in °F
CDD = cooling degree day units (base of 65 degrees) in °F
Norm Max = Daily normal high Temperature (1991-2020 normals) in °F
Norm Min = Daily normal low Temperature (1991-2020 normals) in °F
Norm Mean = Daily normal mean Temperature (1991-2020 normals) in °F
From the record books:
Warmest recorded JULY temperature, 115°F, July 25, 1936.
Coldest recorded JULY temperature, 45°F, July 5, 1995.
Driest July: 0.08 inches, July 1936
Wettest July: 12.50 inches, July 1993
NOTE: All data on this page are from the National Weather Service and HPRCC data archives.