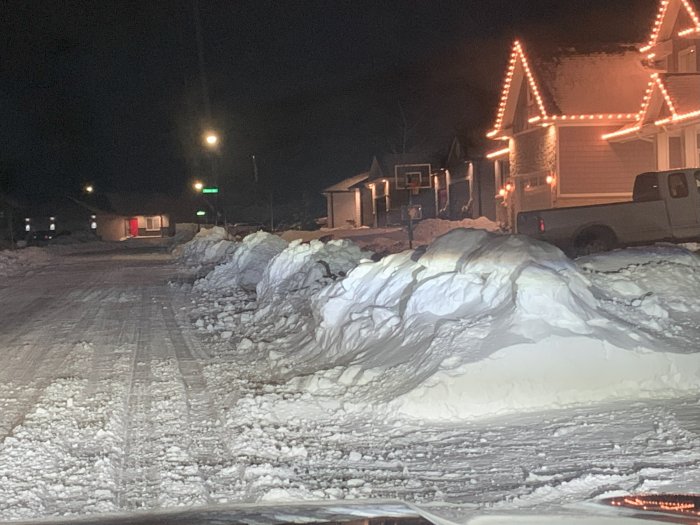
January 12, 2024 (Last Year), Deep Snow-cover in Lincoln, NE. Photo by Ken Dewey
Related Links:
Last month's Data, December 2024 Next month's Data, February 2025
Year 2024 Lincoln Climate Summary
NWS, January 2025: Where's the Snow?
Lincoln's Cold Weather Climatology
Daytime highs below 0°F Climatology
List of all JANUARY Daily Records and years set
Climatology of first snowfalls after Summer
Climatology of length of snow-free season
Omaha Blizzard of January 1975 (Facebook)
Omaha Blizzard of January 1975 (KETV)
Daily FACEBOOK Weather Forecast Updates
Daily TWITTER Weather Forecast Updates
Daily BlueSky Forecast Updates
January 2025 Daylight
January 1: Sunrise 7:51am; Sunset 5:10pm (Daylight 9hr 19min)
January 31: Sunrise 7:37am; Sunset 5:43pm (Daylight 10hr 6min)
RECORDS:
Longest snow free period on record, 352 days
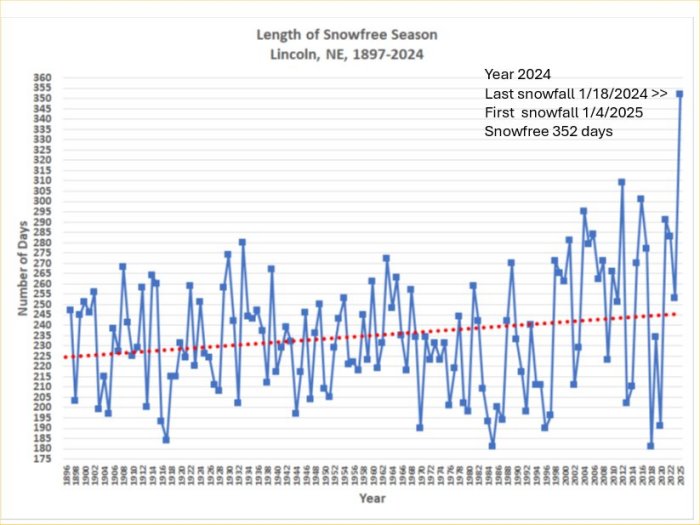
LINK: Calculating snow free period
All data in the following table are from the National Weather Service and HPRCC data archives.
Winter 2024-25 (and last 4 Winters) Snowfall (in inches) compared to normal.
| OCT | NOV | DEC | JAN | FEB | MAR | APR | MAY | TOTAL | |
| Normal | 0.9 | 1.5 | 5.3 | 6.5 | 7.1 | 3.4 | 1.2 | 0.1 | 26.0 |
| 2024-25 | 0.0 | T | T | 1.0 | 1.0 | ||||
| 2023-24 | T | 1.1 | 3.9 | 11.4 | T | T | 0.0 | 0.0 | 16.4 |
| 2022-23 | 0.0 | T | 1.6 | 2.0 | 9.5 | 1.2 | 0.0 | 0.0 | 14.3 |
| 2021-22 | 0.0 | T | 0.8 | 2.9 | 0.1 | 1.3 | T | 0.0 | 5.1 |
| 2020-21 | 2.9 | T | 11.0 | 18.9 | 16.6 | 0.0 | T | 0.0 | 49.4 |
T = a Trace. Snowfall was observed but not enough to be measured
| January | 2025 | Max | Min | Mean | Dep | Pcpn | Rec Pcpn | Rec Max | Rec Min | HDD | CDD | Norm Max | Norm Min | Norm Mean | Snow |
|---|---|---|---|---|---|---|---|---|---|---|---|---|---|---|---|
| Wednesday | Jan. 1 | 41 | 23 | 32 | +6 | 0.00 | 0.40 | 63 | -26 | 33 | 0 | 36 | 15 | 26 | . |
| Thursday | Jan. 2 | 34 | 19 | 27 | +2 | T | 0.34 | 72 | -22 | 38 | 0 | 36 | 15 | 25 | T |
| Friday | Jan. 3 | 30 | 22 | 26 | +1 | T | 1.40 | 63 | -17 | 39 | 0 | 36 | 15 | 25 | T |
| Saturday | Jan. 4 | 22 | 14 | 18 | -7 | 0.07 | 0.34 | 59 | -19 | 47 | 0 | 36 | 15 | 25 | 0.5 |
| Sunday | Jan. 5 | 16 | 11 | 14 | -11 | 0.02 | 0.69 | 68 | -20 | 51 | 0 | 35 | 15 | 25 | 0.5 |
| Monday | Jan. 6 | 25 | 5 | 15 | -10 | 0.00 | 0.40 | 60 | -25 | 50 | 0 | 35 | 15 | 25 | . |
| Tuesday | Jan. 7 | 26 | 3 | 15 | -10 | T | 0.60 | 65 | -20 | 50 | 0 | 35 | 15 | 25 | T |
| Wednesday | Jan. 8 | 25 | 3 | 14 | -11 | 0.00 | 0.61 | 70 | -20 | 51 | 0 | 35 | 14 | 25 | . |
| Thursday | Jan. 9 | 36 | 13 | 25 | 0 | T | 0.37 | 62 | -21 | 40 | 0 | 35 | 14 | 25 | T |
| Friday | Jan.10 | 37 | 17 | 27 | +2 | 0.00 | 0.76 | 73 | -18 | 38 | 0 | 35 | 14 | 25 | . |
| Saturday | Jan. 11 | 45 | 17 | 31 | +6 | 0.00 | 0.31 | 65 | -29 | 34 | 0 | 35 | 14 | 25 | . |
| Sunday | Jan.12 | 39 | 11 | 25 | 0 | T | 0.74 | 64 | -33 | 40 | 0 | 35 | 14 | 25 | T |
| Monday | Jan.13 | 35 | 7 | 21 | -4 | 0.00 | 0.30 | 70 | -21 | 44 | 0 | 35 | 14 | 25 | . |
| Tuesday | Jan. 14 | 25 | 9 | 17 | -8 | 0.00 | 0.61 | 60 | -18 | 48 | 0 | 35 | 14 | 25 | . |
| Wednesday | Jan.15 | 42 | 13 | 28 | +3 | 0.00 | 0.83 | 69 | -27 | 37 | 0 | 35 | 14 | 25 | . |
| Thursday | Jan.16 | 54 | 29 | 42 | +17 | 0.00 | 0.60 | 66 | -19 | 23 | 0 | 35 | 14 | 25 | . |
| Friday | Jan.17 | 53 | 25 | 39 | +14 | 0.00 | 0.45 | 64 | -16 | 26 | 0 | 35 | 14 | 25 | . |
| Saturday | Jan.18 | 26 | 9 | 18 | -7 | 0.00 | 0.82 | 66 | -21 | 47 | 0 | 35 | 14 | 25 | . |
| Sunday | Jan. 19 | 15 | -6 | 5 | -20 | 0.00 | 0.78 | 66 | -29 | 60 | 0 | 35 | 14 | 25 | . |
| Monday | Jan. 20 | 11 | -7 | 2 | -23 | 0.00 | 0.61 | 68 | -18 | 63 | 0 | 36 | 14 | 25 | . |
| Tuesday | Jan.21 | 24 | -11 | 7 | -18 | 0.00 | 0.55 | 64 | -17 | 58 | 0 | 36 | 14 | 25 | . |
| Wednesday | Jan.22 | 41 | 18 | 30 | +5 | T | 0.64 | 60 | -14 | 35 | 0 | 36 | 14 | 25 | T |
| Thursday | Jan. 23 | 27 | 11 | 19 | -6 | 0.00. | 0.45 | 68 | -20 | 46 | 0 | 36 | 14 | 25 | . |
| Friday | Jan.24 | 49 | 9 | 29 | +4 | 0.00 | 0.46 | 72 | -19 | 36 | 0 | 36 | 14 | 25 | . |
| Saturday | Jan.25 | 41 | 20 | 31 | +6 | 0.00 | 1.13 | 69 | -21 | 34 | 0 | 36 | 14 | 25 | . |
| Sunday | Jan.26 | 38 | 14 | 26 | +1 | 0.00 | 0.81 | 68 | -17 | 39 | 0 | 36 | 14 | 25 | . |
| Monday | Jan. 27 | 56 | 15 | 36 | +11 | 0.00 | 0.80 | 68 | -23 | 29 | 0 | 36 | 15 | 25 | . |
| Tuesday | Jan.28 | 60 | 19 | 40 | +15 | 0.00 | 0.90 | 64 | -22 | 25 | 0 | 36 | 15 | 25 | . |
| Wednesday | Jan.29 | 60 | 18 | 39 | +13 | 0.00 | 0.52 | 66 | -18 | 26 | 0 | 36 | 15 | 26 | . |
| Thursday | Jan.30 | 49 | 23 | 36 | +10 | 0.01 | 0.34 | 70 | -16 | 29 | 0 | 37 | 15 | 26 | . |
| Friday | Jan.31 | 54 | 20 | 37 | +11 | 0.00 | 0.82 | 72 | -20 | 28 | 0 | 37 | 15 | 26 | . |
| 2025 | Max | Min | Mean | Dep | Pcpn | Rec Pcpn | Rec Max | Rec Min | HDD | CDD | Norm Max | Norm Min | Norm Mean | Snow | |
| . | Total | 0.10 | 1244 | 0 | 1.0 | ||||||||||
| . | Average | 36.6 | 12.7 | 24.7 | |||||||||||
| Normal | 35.6 | 14.4 | 25.0 | 0.73 | 1240 | 0 | 6.5 | ||||||||
| . | Departure | +1.0 | -1.7 | -0.3 | -0.63 | +4 | 0 | -5.5 |
AVERAGE AND TOTAL are JANUARY 2025
Temperature is °F
Precipitation measurement is "inches"
Precipitation "T" = trace, precipitation was observed but not enough to be measured
Norm = the 1991-2020 Standard Normals.
DEPARTURE is JANUARY 2025 average measured against 1991-2020 normals.
Max = Observed Maximum and Min = Observed Minimum temperatures in °F.
Mean = Observed Mean Daily temperature in °F.
Dep = Departure from normal (- is below normal, + is above normal), in °F.
Pcpn = Observed daily precipitation (midnight to midnight, CST) in inches.
Rec Pcpn = Record daily amount of precipitation in inches.
Rec Max = Record maximum temperature in °F.
Rec Min = Record Minimum temperature in °F.
HDD = heating degree day units (base of 65 degrees) in °F.
CDD = cooling degree day units (base of 65 degrees) in °F.
Norm Max = Daily Normal High Temperature (1991-2020 normals) in °F.
Norm Min = Daily Normal Low Temperature (1991-2020 normals) in °F.
Norm Mean = Daily Normal Mean Temperature (1991-2020 normals) in °F.
Snow = Snowfall in inches.
FROM THE RECORD BOOKS:
Warmest recorded JANUARY temperature, 73°F, January 10, 1990
Coldest recorded JANUARY temperature, -33°F, January 12, 1974
SNOWFALL: 128 years (1897-2024)
Most JANUARY Snowfall: 23.0 inches, 1915.
Least January Snowfall: Trace (observed but not measurable), 3 of the last 128 years (2006, 1986, 1900)
January Most precipitation (rain plus melted snow) = 3.15 inches, 1949
January Least precipitation (rain plus melted snow) = 0.00 inches, 1986 and 1943
NOTE: All data on this page are from the National Weather Service and the HPRCC data archives.