Content
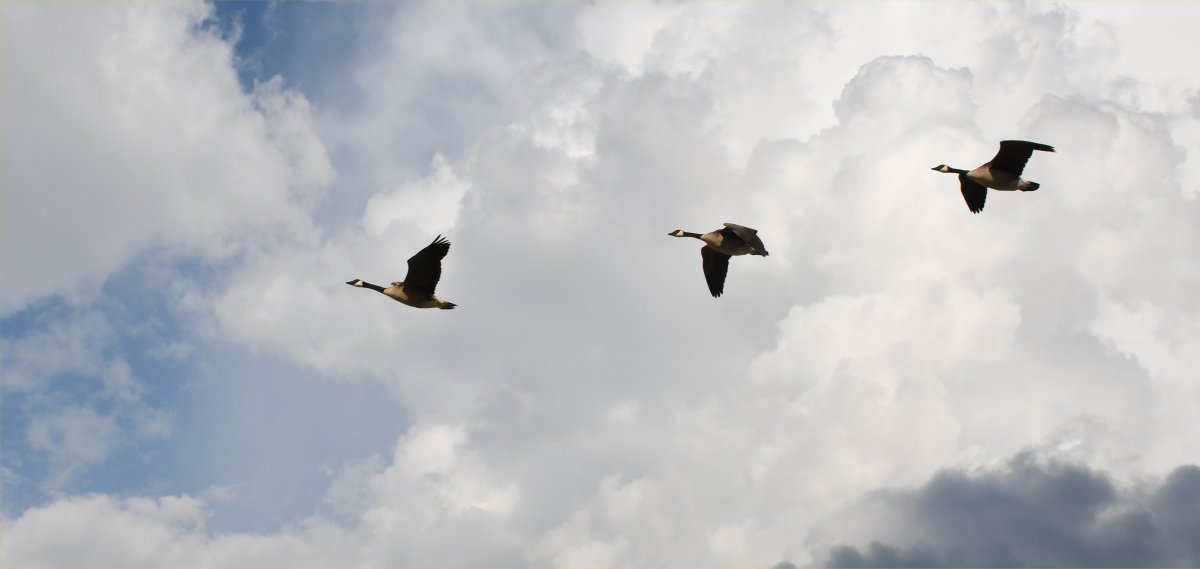
Several geese flying by with a nearby developing thunderstorm over Lincoln, NE,
Photo Ken Dewey, August 1, 2020.
Last Month's Data (July 2025) Next Month's Data (September 2025)
Lincoln's Hot Weather Climatology>> Hot weather climatology
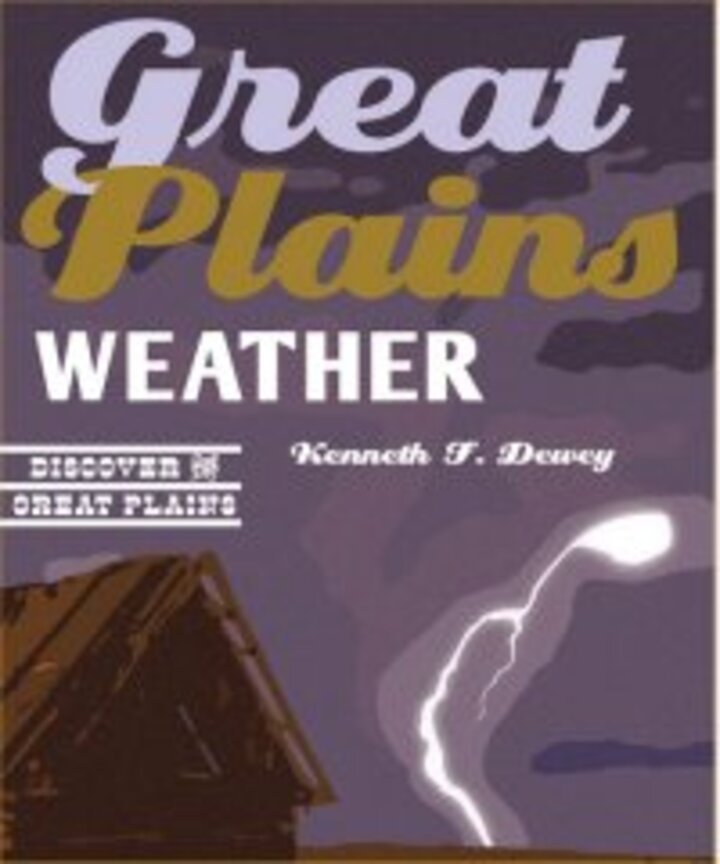
Great Plains Weather book available at Nebraska Press
Great Plains Weather Book Review Comments
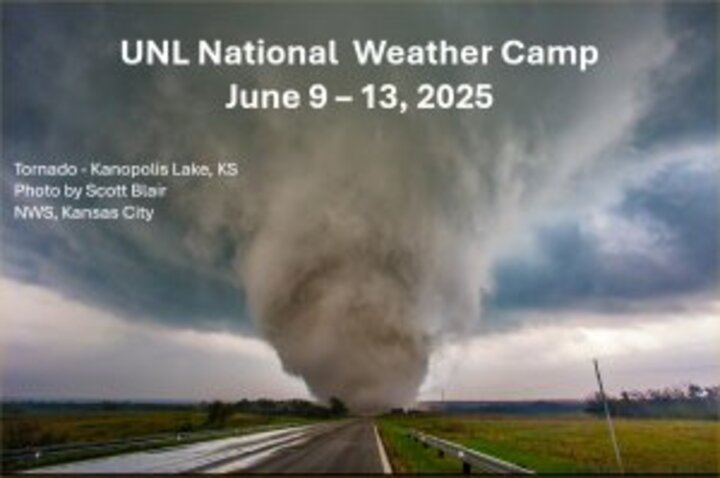
Link: Photo Gallery June 2025 UNL National Weather Camp
Year 2025 (and last year) Lincoln precipitation (inches), rain + melted snow
| JAN | FEB | MAR | APR | MAY | JUN | JUL | AUG | SEP | OCT | NOV | DEC | TOTAL | |
| Normal | 0.73 | 0.89 | 1.55 | 2.69 | 4.91 | 4.48 | 3.25 | 3.32 | 2.90 | 2.14 | 1.30 | 1.18 | 29.34 |
| 2025 | 0.10 | 0.31 | 0.95 | 1.71 | 3.05 | 3.22 | 3.93 | 4.89 | 18.16 | ||||
| 2024 | 0.95 | 0.51 | 1.09 | 3.42 | 4.78 | 3.28 | 7.23 | 1.50 | 0.20 | 1.08 | 3.85 | 0.61 | 28.50 |
Normal January 1 - July 31 Precipitation total = 18.50 inches
Normal January 1 - August 31 Precipitation total = 21.82 inches
RECORD daily precipitation, August 10, 2025, 3.16 inches (old record 1.33 inches set in 1968).
LINK to Storm Report: Damaging Winds August 9-10, 2025
August 2025 Lincoln, NE, Daylight:
August 1: Sunrise 6:23am; Sunset 8:41pm (Daylight 14hr 18min)
August 31: Sunrise 6:53am; Sunset 7:59pm (Daylight 13hr 07min)
All data in the following table are from the National Weather Service and HPRCC data archives.
| August | 2025 | Max | Min | Mean | Dep | Pcpn | Rec Pcpn | Rec Max | Rec Min | HDD | CDD | Norm Max | Norm Min | Norm Mean |
|---|---|---|---|---|---|---|---|---|---|---|---|---|---|---|
| Friday | Aug. 1 | 74 | 60 | 67 | -11 | 0.00 | 2.39 | 105 | 48 | 0 | 2 | 89 | 67 | 78 |
| Saturday | Aug. 2 | 79 | 54 | 67 | -11 | T | 2.04 | 107 | 52 | 0 | 2 | 89 | 67 | 78 |
| Sunday | Aug. 3 | 71 | 63 | 67 | -11 | 0.01 | 2.05 | 108 | 51 | 0 | 2 | 89 | 66 | 78 |
| Monday | Aug. 4 | 80 | 59 | 70 | -8 | 0.14 | 1.68 | 109 | 45 | 0 | 5 | 89 | 66 | 78 |
| Tuesday | Aug. 5 | 86 | 64 | 75 | -3 | 0.00 | 1.60 | 109 | 48 | 0 | 10 | 89 | 66 | 78 |
| Wednesday | Aug. 6 | 87 | 67 | 77 | 0 | 0.49 | 1.68 | 104 | 49 | 0 | 12 | 89 | 66 | 77 |
| Thursday | Aug. 7 | 90 | 71 | 81 | +4 | 0.00 | 2.02 | 104 | 44 | 0 | 16 | 89 | 66 | 77 |
| Friday | Aug. 8 | 94 | 75 | 85 | +8 | 0.00 | 1.71 | 110 | 50 | 0 | 20 | 88 | 66 | 77 |
| Saturday | Aug. 9 | 85 | 68 | 77 | 0 | 0.20 | 1.69 | 106 | 48 | 0 | 12 | 88 | 66 | 77 |
| Sunday | Aug. 10 | 86 | 68 | 77 | 0 | 3.16 | 3.16 | 104 | 48 | 0 | 12 | 88 | 66 | 77 |
| Monday | Aug. 11 | 81 | 66 | 74 | -3 | 0.01 | 1.94 | 105 | 48 | 0 | 9 | 88 | 65 | 77 |
| Tuesday | Aug. 12 | 86 | 62 | 74 | -3 | 0.00 | 2.94 | 107 | 47 | 0 | 9 | 88 | 65 | 77 |
| Wednesday | Aug. 13 | 87 | 62 | 75 | -1 | 0.00 | 1.83 | 108 | 49 | 0 | 10 | 88 | 65 | 76 |
| Thursday | Aug. 14 | 90 | 70 | 80 | +4 | 0.01 | 3.32 | 103 | 45 | 0 | 15 | 88 | 65 | 76 |
| Friday | Aug. 15 | 95 | 73 | 84 | +8 | 0.00 | 1.72 | 106 | 48 | 0 | 19 | 88 | 65 | 76 |
| Saturday | Aug. 16 | 95 | 76 | 86 | +10 | 0.00 | 4.27 | 107 | 49 | 0 | 21 | 87 | 64 | 76 |
| Sunday | Aug. 17 | 93 | 74 | 84 | +8 | 0.00 | 2.54 | 107 | 44 | 0 | 19 | 87 | 64 | 76 |
| Monday | Aug. 18 | 91 | 71 | 81 | +5 | 0.08 | 2.36 | 110 | 45 | 0 | 16 | 87 | 64 | 76 |
| Tuesday | Aug. 19 | 91 | 71 | 81 | +6 | 0.00 | 1.88 | 104 | 45 | 0 | 16 | 87 | 64 | 75 |
| Wednesday | Aug. 20 | 90 | 68 | 79 | +4 | 0.01 | 2.73 | 102 | 39 | 0 | 14 | 87 | 64 | 75 |
| Thursday | Aug. 21 | 91 | 66 | 79 | +4 | 0.00 | 2.41 | 104 | 47 | 0 | 14 | 87 | 63 | 75 |
| Friday | Aug. 22 | 90 | 64 | 77 | +2 | 0.04 | 2.94 | 105 | 46 | 0 | 12 | 86 | 63 | 75 |
| Saturday | Aug. 23 | 78 | 57 | 68 | -7 | 0.00 | 1.28 | 103 | 43 | 0 | 3 | 86 | 63 | 75 |
| Sunday | Aug. 24 | 76 | 56 | 66 | -8 | 0.03 | 1.90 | 107 | 43 | 0 | 1 | 86 | 63 | 74 |
| Monday | Aug. 25 | 77 | 52 | 65 | -9 | 0.00 | 3.09 | 105 | 45 | 0 | 0 | 86 | 62 | 74 |
| Tuesday | Aug. 26 | 81 | 52 | 67 | -7 | 0.00 | 2.24 | 105 | 48 | 0 | 2 | 86 | 62 | 74 |
| Wednesday | Aug. 27 | 80 | 56 | 68 | -6 | 0.00 | 1.34 | 104 | 47 | 0 | 3 | 86 | 62 | 74 |
| Thursday | Aug. 28 | 78 | 60 | 69 | -5 | 0.00 | 2.93 | 103 | 41 | 0 | 4 | 85 | 61 | 74 |
| Friday | Aug. 29 | 82 | 56 | 69 | -4 | 0.00 | 5.45 | 101 | 41 | 0 | 4 | 85 | 61 | 73 |
| Saturday | Aug. 30 | 73 | 65 | 69 | -4 | 0.42 | 2.62 | 103 | 42 | 0 | 4 | 85 | 61 | 73 |
| Sunday | Aug. 31 | 68 | 64 | 66 | -7 | 0.29 | 1.96 | 103 | 42 | 0 | 1 | 85 | 60 | 73 |
| . | 2025 | Max | Min | Mean | Dep | Pcpn | Rec Pcpn | Rec Max | Rec Min | HDD | CDD | Avg Max | Avg Min | Avg Mean |
| . | TOTAL | 4.89 | 0 | 289 | ||||||||||
| . | AVERAGE | 84.0 | 64.2 | 74.1 | ||||||||||
| NORMAL | 87.2 | 64.1 | 75.6 | 3.32 | 3 | 333 | ||||||||
| . | DEPARTURE | -3.2 | +0.1 | -1.5 | +1.57 | -3 | -44 |
AVERAGE and TOTAL are August 2025.
Temperature is °F
Precipitation measurement is "inches"
Precipitation "T" = trace, precipitation was observed but not enough to be measured
NORMAL (Norm) refers to the 1981-2010 Standard Normals
DEPARTURE is AUGUST 2025 Averages & totals compared to 1981-2010 normals.
Max = Observed Maximum and Min = Observed Minimum temperatures in °F
Mean = Observed Mean Daily temperature in °F
Dep = Departure from normal ( - is below normal, + is above normal), in °F
Pcpn = Observed daily precipitation (midnight to midnight, CST) in inches.
Rec Pcpn = Record daily amount of precipitation in inches.
Rec Max = Record maximum temperature in °F
Rec Min = Record minimum temperature in °F
HDD = heating degree day units (base of 65 degrees) in °F
CDD = cooling degree day units (base of 65 degrees) in °F
Norm Max = Daily Normal High Temperature (1981-2010 normals) in °F
Norm Min = Daily Normal Low Temperature (1981-2010 normals) in °F
Norm Mean = Daily Normal Mean Temperature (1981-2010 normals) in °F
From the record books: Data: 1887-2024 (138 years)
TEMPERATURE:
Hottest recorded August temperature, 110°F, August 8, 1934 & August 18, 1936.
Coldest recorded August temperature, 39°F, August 20, 1950.
PRECIPITATION:
Wettest August total precipitation: 13.98 inches, August 1910
Driest August total precipitation: 0.07 inches, August 1976
NOTE: All data on this page are from the National Weather Service and HPRCC data archives.
...