Content
LINKS to additional Lincoln, NE, Data not at this page:
The 90s (and 80s)
Monthly frequency (totals) of daily highs 90°F or Higher
Monthly frequency (totals) of daily highs 80°F or Higher
Longest Streaks of 90°F or higher temperatures
Months with temperatures 90°F or higher
Dates of first 90°F or higher temperature, 1887 - present
Dates of last 90°F or higher temperature 1887 - present
Daily frequencies of 90°F or higher 1887 to present
The 100s
Monthly and annual number of days with temperatures 100°F or higher
Daily frequencies of temperatures 100°F or higher
Dates of first 100°F or higher
______________________________________________________________
Date of the hottest day each year
-------------------------------------------------------------------------------------------------------------
The hottest day ever recorded in Lincoln, NE:
July 25, 1936
High: 115°F Low: 91°F
Average temperature for the day = 103°F !
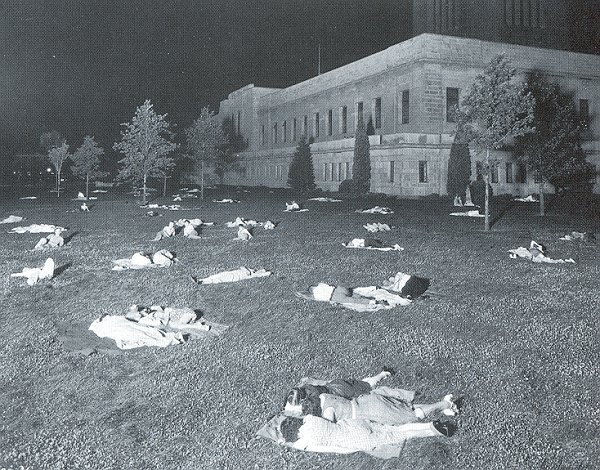
With an overnight low of only 91°F after a daytime high of 115°F, residents of Lincoln
spent the night on the capitol lawn to escape the heat inside their homes and apartments.
(Photo courtesy: Nebraska Historical Society)
Days with daily high temperatures 90°F or higher, Year 2025
| April 28: 91°F | June 21: 100°F | July 9: 91°F | July 29: 98°F | Aug. 21: 91°F |
| May 10: 90°F | June 22: 97°F | July 10: 92°F | Aug. 7: 90°F | Aug. 20: 90°F |
| May14: 90°F | June 23: 90°F | July 14: 94°F | Aug. 8: 94°F | Sept. 12: 93°F |
| June 2: 90°F | June 25: 93°F | July 15: 94°F | Aug. 14: 90°F | Sept. 13: 95°F |
| June 11: 94°F | June 27: 91°F | July 19: 91°F | Aug. 15: 95°F | Sept. 16: 91°F |
| June 14: 90°F | July 2: 94°F | July 20: 91°F | Aug. 16: 95°F | Oct. 3: 90°F |
| June 15: 92°F | July 3: 92°F | July 23: 93°F | Aug. 17: 93°F | |
| June 16: 93°F | July 4: 90°F | July 26: 91°F | Aug. 18: 91°F | |
| June 19: 93°F | July 5: 91°F | July 27: 96°F | Aug. 19: 91°F | |
| June 20: 102°F | July 7: 91°F | July 28: 97°F | Aug. 20: 90°F |
The total number of days with the temperature 90°F or higher for Lincoln, NE
NORMALS* (standard 1991-2020, 30-year normals)
NOTE: All data on this page are from the National Weather Service and HPRCC data archives. |