
Photo by Ken Dewey
Last Month's Data, September 2024
Next Month's Data, November 2024
Year 2024 (and last year) Lincoln Precipitation in Inches compared to normal
| JAN | FEB | MAR | APR | MAY | JUN | JUL | AUG | SEP | OCT | NOV | DEC | TOTAL | |
| Normal | 0.73 | 0.89 | 1.55 | 2.69 | 4.91 | 4.48 | 3.25 | 3.32 | 2.90 | 2.14 | 1.30 | 1.18 | 29.34 |
| 2024 | 0.95 | 0.51 | 1.09 | 3.42 | 4.78 | 3.28 | 7.23 | 1.50 | 0.20 | T | . | . | 22.96 |
| 2023 | 1.32 | 1.29 | 0.63 | 0.59 | 0.51 | 4.53 | 5.61 | 3.76 | 0.60 | 1.42 | 0.56 | 1.71 | 22.53 |
Normal January 1 - September 30 Precipitation = 24.72 inches
Normal January 1 - October 31 Precipitation = 26.86 inches
Lincoln's October 2024 Sun data
October 1: Sunrise 7:23 am; Sunset 7:07 pm, Daylight: 11 hours, 44 min
October 31: Sunrise 7:56 am; Sunset 6:23 pm, Daylight: 10 hours, 27 min
Lincoln's Earliest Snowfalls in Autumn
First freeze following Summer, 1887 - 2024
Growing season length, 1887 - 2024
Last freeze following Winter, 1887 - 2024
Lincoln's hot weather climatology
October 10, 2024: Tied record high of 91°F, first set in 1963, 1931 and 1928

All data in the following tables are from the National Weather Service and HPRCC data archives.
>>>>> Record highs & lows xmacis verified
If columns are hidden, scroll the table right.
Pcpn | Max | Min | Max | Norm Min | Norm Mean | Snow | |||||||||
|---|---|---|---|---|---|---|---|---|---|---|---|---|---|---|---|
|
Tuesday
|
Oct. 1
|
72
|
48
|
60
|
-1
|
0.00
|
1.65
|
94
|
27
|
5
|
0
|
74
|
48
|
61
|
.
|
|
Wednesday.
|
Oct. 2
|
85
|
42
|
64
|
+4
|
0.00
|
1.28
|
94
|
28
|
1
|
0
|
74
|
47
|
60
|
.
|
|
Thursday
|
Oct. 3
|
84
|
48
|
66
|
+6
|
T
|
2.10
|
96
|
27
|
0
|
1
|
73
|
47
|
60
|
.
|
|
Friday
|
Oct. 4
|
80
|
49
|
65
|
+5
|
0.00
|
1.20
|
93
|
29
|
0
|
0
|
73
|
46
|
60
|
.
|
|
Saturday
|
Oct. 5
|
97
|
48 |
73
|
+14 |
0.00
|
1.34
|
98
|
28
|
0
|
8
|
72
|
46
|
59
|
.
|
|
Sunday
|
Oct. 6
|
76
|
41
|
59
|
0
|
0.00 |
1.18
|
93
|
24
|
6
|
0
|
72
|
45
|
59
|
.
|
|
Monday
|
Oct. 7
|
75
|
35
|
55
|
-3
|
0.00
|
1.18
|
90
|
20
|
10
|
0
|
71
|
45
|
58
|
.
|
|
Tuesday
|
Oct. 8
|
82
|
41
|
62
|
+4
|
0.00
|
1.79
|
91
|
17
|
3
|
0
|
71
|
45
|
58
|
.
|
|
Wednesday
|
Oct. 9
|
86
|
41
|
64
|
+7
|
0.00
|
1.73
|
90
|
18
|
1
|
0
|
70
|
44
|
57
|
.
|
|
Thursday
|
Oct. 10
|
91
|
50
|
71
|
+14
|
0.00
|
2.26
|
91
|
23
|
0
|
6
|
70
|
44
|
57
|
.
|
|
Friday
|
Oct. 11
|
86
|
56
|
71
|
+15
|
0.00
|
2.74
|
94
|
21
|
0
|
6
|
69
|
43
|
56
|
.
|
|
Saturday
|
Oct. 12
|
80
|
47
|
64
|
+8
|
0.00
|
2.59
|
93
|
21
|
1
|
0
|
69
|
43
|
56
|
.
|
|
Sunday
|
Oct. 13
|
65
|
38
|
52
|
-3
|
0.00
|
1.13
|
92
|
22
|
13
|
0
|
68
|
42
|
55
|
.
|
|
Monday
|
Oct. 14
|
64
|
30
|
47
|
-8
|
0.00
|
0.86
|
91
|
24
|
18
|
0
|
68
|
42
|
55
|
.
|
|
Tuesday
|
Oct. 15
|
.
|
.
|
.
|
.
|
.
|
1.12
|
91
|
22
|
.
|
.
|
67
|
41
|
54
|
.
|
|
Wednesday
|
Oct. 16
|
.
|
.
|
.
|
.
|
.
|
1.74
|
88
|
21
|
.
|
.
|
67
|
41
|
54
|
.
|
|
Thursday
|
Oct. 17
|
.
|
.
|
.
|
.
|
.
|
1.18
|
85
|
15
|
.
|
.
|
66
|
41
|
53
|
.
|
|
Friday
|
Oct. 18
|
.
|
.
|
.
|
.
|
.
|
1.27
|
87
|
18
|
.
|
.
|
66
|
40
|
53
|
.
|
|
Saturday
|
Oct. 19
|
.
|
.
|
.
|
.
|
.
|
1.02
|
88
|
12
|
.
|
.
|
65
|
40
|
52
|
.
|
|
Sunday
|
Oct. 20
|
.
|
.
|
.
|
.
|
.
|
0.46
|
90
|
18
|
.
|
.
|
65
|
39
|
52
|
.
|
|
Monday
|
Oct. 21
|
.
|
.
|
.
|
.
|
.
|
0.75
|
89
|
20
|
.
|
.
|
64
|
39
|
51
|
.
|
|
Tuesday
|
Oct. 22
|
.
|
.
|
.
|
.
|
.
|
2.01
|
89
|
19
|
.
|
.
|
64
|
38
|
51
|
.
|
|
Wednesday
|
Oct. 23
|
.
|
.
|
.
|
.
|
.
|
1.18
|
89
|
20
|
.
|
.
|
63
|
38
|
51
|
.
|
|
Thursday
|
Oct. 24
|
.
|
.
|
.
|
.
|
.
|
0.85
|
89
|
17
|
.
|
.
|
63
|
38
|
50
|
.
|
|
Friday
|
Oct. 25
|
.
|
.
|
.
|
.
|
.
|
2.19
|
89
|
15
|
.
|
.
|
62
|
37
|
50
|
.
|
|
Saturday
|
Oct. 26
|
.
|
.
|
.
|
.
|
.
|
1.57
|
86
|
19
|
.
|
.
|
62
|
37
|
49
|
.
|
|
Sunday
|
Oct. 27
|
.
|
.
|
.
|
.
|
.
|
0.97
|
89
|
8
|
.
|
.
|
61
|
36
|
49
|
.
|
|
Monday
|
Oct. 28
|
.
|
.
|
.
|
.
|
.
|
1.56
|
84
|
10
|
.
|
.
|
61
|
36
|
48
|
.
|
|
Tuesday
|
Oct. 29
|
.
|
.
|
.
|
.
|
.
|
1.98
|
87
|
9
|
.
|
.
|
60
|
36
|
48
|
.
|
|
Wednesday
|
Oct. 30
|
.
|
.
|
.
|
.
|
.
|
4.07
|
83
|
3
|
.
|
.
|
60
|
35
|
47
|
.
|
|
Thursday
|
Oct. 31
|
.
|
.
|
.
|
.
|
.
|
2.07
|
83
|
11
|
.
|
.
|
59
|
34
|
47
|
.
|
|
October
|
2024
|
Max
|
Min
|
Mean
|
Dep
|
Pcpn
|
Rec
Pcpn |
Rec
Max |
Rec
Min |
HDD
|
CDD
|
Avg
Max |
Avg
Min |
Avg
Mean |
|
| as of 10/14 |
TOTAL
|
T
|
|
|
.
|
.
|
|
|
|
.
|
|||||
| as of 10/14 |
AVERAGE
|
80.2
|
43.9
|
62.0
|
|
|
|
|
|
|
|
||||
| all Oct. |
NORMAL
|
66.6
|
41.0
|
53.8
|
2.14
|
|
|
367
|
20
|
|
|
|
0.9
|
||
| . |
DEPARTURE
|
.
|
.
|
.
|
.
|
.
|
.
|
.
|
AVERAGE AND TOTAL are OCTOBER 2024.
Temperature is "degrees F"
Precipitation measurement is "inches"
Precipitation "T" = trace, precipitation was observed but not enough to be measured
NORMAL (Norm) refers to the 1991-2020 Standard normals.
DEPARTURE is OCTOBER 2024 Averages and totals measured against 1991-2020 Normals.
Max = Observed Maximum and Min = Observed Minimum temperatures in °F.
Mean = Observed Mean Daily temperature in °F.
Dep = Departure from normal (- is below normal, + is above normal), in °F.
Pcpn = Observed daily precipitation (midnight to midnight, CST) in inches.
Rec Pcpn = Record daily amount of precipitation in inches.
Rec Max = Record Maximum temperature in °F.
Rec Min = Record Minimum temperature in °F.
HDD = heating degree day units (base of 65 degrees) in °F.
CDD = cooling degree day units (base of 65 degrees) in °F.
Norm Max = Daily Normal High Temperature (1991-2020 normals) in °F.
Norm Min = Daily Normal Low Temperature (1991-2020 normals) in °F.
Norm Mean = Daily Normal Mean Temperature (1991-2020 normals) in °F.
Snow = Snowfall in inches.
From the record books:
Hottest recorded October temperature, 98°F, October 5, 1947
Coldest recorded October temperature, 3°F, October 30, 1925
Wettest October: 5.40 inches, 1986
Driest October: 0.00 inches. 1952
SNOWFALL (124 years, 1900-2023):
Earliest ever first snowfall, September 28, 1985, 0.8 inches.
Most ever October snowfall, 13.2 inches, October 26, 1997.
Octobers with measurable snowfall (1900-2023) 21 years since 1900 (21/124 years= 17%)
Octobers without measurable snowfall (1900-2023) 101 years since 1900 (103/124 years = 83%)
LINK: October 14, 2018 snowfall compared to Lincoln's Earliest Snowfalls
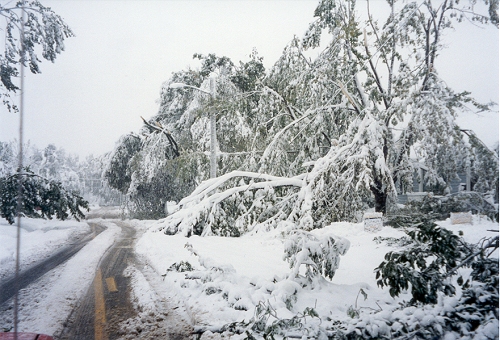
The yellow "do not pass" line is ignored as we wind our way through
the tree covered streets of Lincoln on October 25, 1997
October 10, 2009 LINK: Third Earliest Snowfall for Lincoln, NE
NOTE: All data on this page are from the National Weather Service and HPRCC data archives.