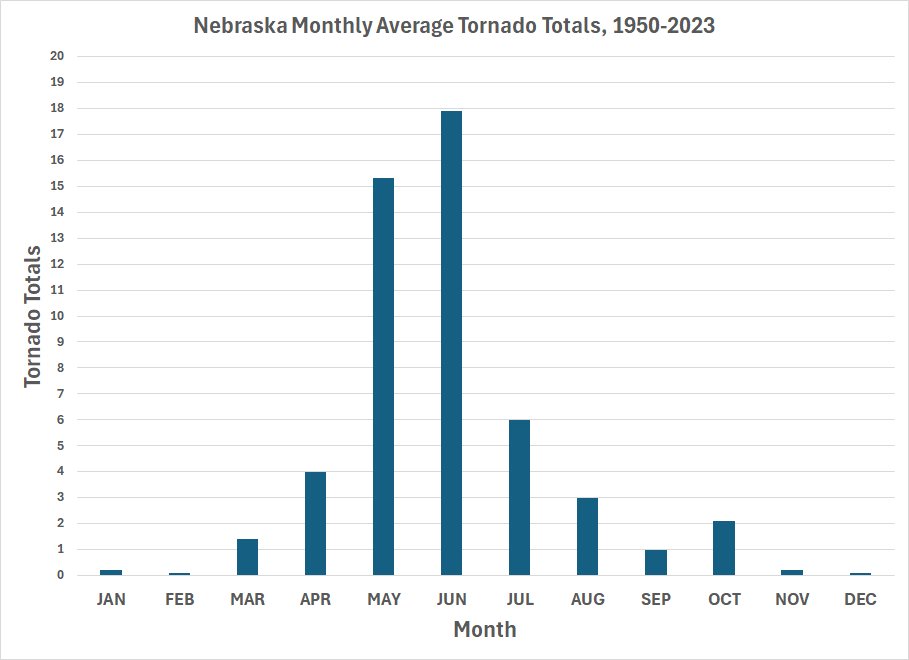
RETURN to the U.S. and Nebraska Tornado Page
If columns are hidden, scroll the table right.
Data Source: NWS Omaha
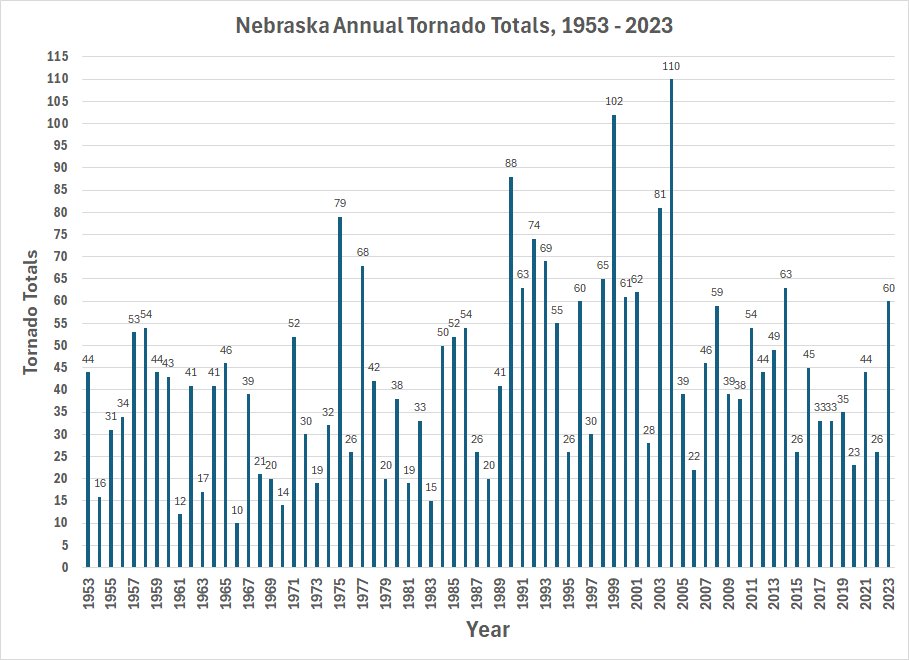
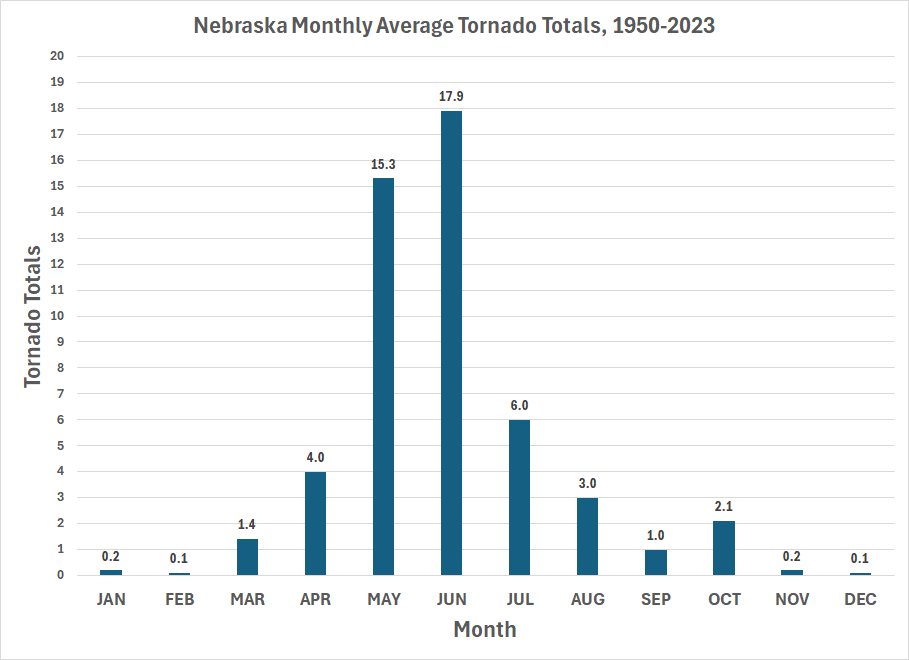
NOTE several graphs can be found below the table!
|
2023
|
0
|
0
|
0
|
0
|
31
|
15
|
7
|
2
|
0
|
5
|
0
|
0
|
2023
|
60
|
|
2022
|
0
|
0
|
0
|
10
|
6
|
9
|
1
|
0
|
0
|
0
|
0
|
0
|
2022
|
26
|
|
2021
|
0
|
0
|
1
|
0
|
14
|
0
|
1
|
0
|
0
|
0
|
0
|
28
|
2021
|
44
|
|
2020
|
0
|
0
|
0
|
0
|
2
|
8
|
7
|
6
|
0
|
0
|
0
|
0
|
2020
|
23
|
|
2019
|
0
|
0
|
0
|
0
|
25
|
1
|
4
|
4
|
1
|
0
|
0
|
0
|
2019
|
35
|
|
2018
|
0
|
0
|
0
|
0
|
6
|
24
|
1
|
1
|
1
|
0
|
0
|
0
|
2018
|
33
|
|
2017
|
0
|
0
|
0
|
2
|
4
|
19
|
0
|
7
|
0
|
1
|
0
|
0
|
2017
|
33
|
|
2016
|
0
|
0
|
0
|
5
|
13
|
3
|
10
|
6
|
2
|
0
|
3
|
3
|
2016
|
45
|
|
2015
|
0
|
0
|
0
|
0
|
16
|
2
|
3
|
3
|
1
|
0
|
1
|
0
|
2015
|
26
|
|
2014
|
0
|
0
|
0
|
3
|
23
|
35
|
1
|
0
|
1
|
0
|
0
|
0
|
2014
|
63
|
|
2013
|
0
|
0
|
3
|
1
|
23
|
9
|
4
|
0
|
0
|
9
|
0
|
0
|
2013
|
49
|
|
2012
|
0
|
2
|
6
|
2
|
0
|
0
|
2012
|
44
|
||||||
|
2011
|
0
|
0
|
1
|
0
|
13
|
24
|
3
|
13
|
0
|
0
|
0
|
0
|
2011
|
54
|
|
2010
|
0
|
0
|
0
|
1
|
9
|
22
|
5
|
0
|
1
|
0
|
0
|
0
|
2010
|
38
|
|
8
|
3
|
2
|
24
|
1
|
0
|
1
|
39
|
|||||||
|
0
|
2
|
18
|
34
|
3
|
2
|
0
|
59
|
|||||||
|
16
|
5
|
14
|
3
|
2
|
5
|
1
|
46
|
|||||||
| JAN | FEB | MAR | APR | MAY | JUN | JUL | AUG | SEP | OCT | NOV | DEC | |||
|
1950-
2023 |
0.1
|
0.0
|
0.9
|
3.6
|
12.2
|
14.1
|
5.4
|
2.6
|
0.9
|
1.2
|
0.1
|
0.4
|
#1 |
41.5
|
|
1991-2020
|
0.2
|
0.1
|
1.4
|
4.0
|
15.3
|
17.9
|
6.0
|
3.0
|
1.0
|
2.1
|
0.2
|
0.1
|
#2 |
51.1
|
|
1981-2010
|
0.2
|
0.0
|
1.8
|
4.5
|
13.7
|
18.8
|
6.3
|
2.7
|
1.1
|
1.8
|
0.1
|
0.0
|
#3
|
50.9 |
Why are there three different averages listed?
|
#1. The 1950-2021 is the average for the full 74 year data set. #2. The 1991-2020 average is the latest 30-year average time period.
|


Nebraska annual totals 1950 (6); 1951 (9) and 1952 (9) are considered to be very undercounted.
A reliable reporting sytem was not instituted until 1953, so the above graph starts at 1953 not 1950.
