RETURN to the U.S. and Nebraska Tornado Page
Tornado (E)F-Scale Trends.
The Storm Prediction Center (SPC) has a tornado mapping program called Severe Plot. The data archive with this program extends from 1950 through 2022.
NOTE: The 2023 data will be released mid-year 2024. Preliminary vs final tornado counts
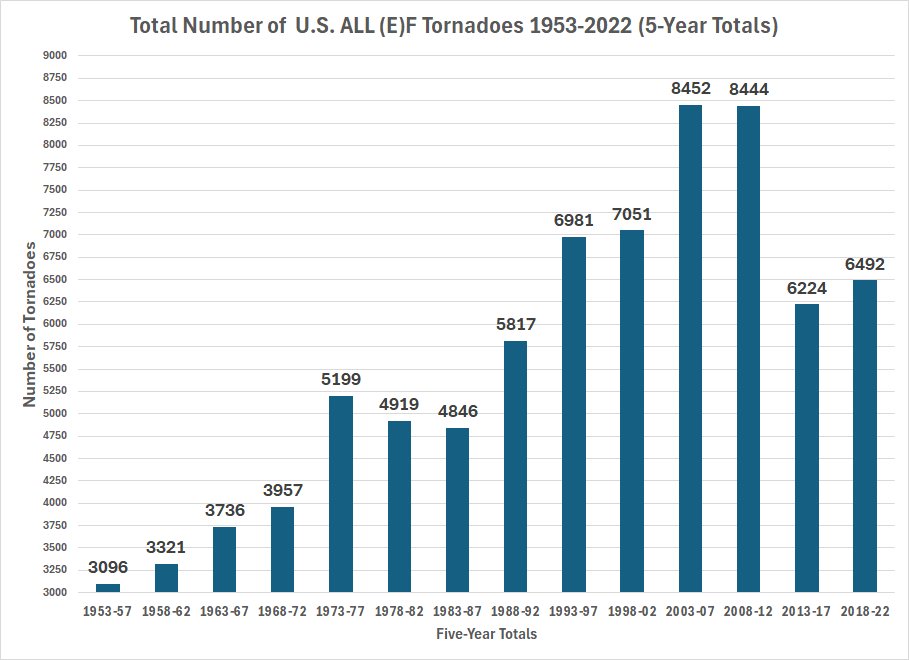
There were 78,535 (E)F rated tornadoes in this analysis 1953-2022.
Remember that the original F-Scale system was replaced with the EF-Scale in 2007. The two scales are equivalent. For example, an older F2 tornado, is considered to be the equivalent of the newer EF2 scale tornado for intensity and damage and mapping purposes.
Working back from the 2022 data, the (E)F U.S. data were grouped into 5 year periods.
Each 5-year period data were then entered into the table below here.
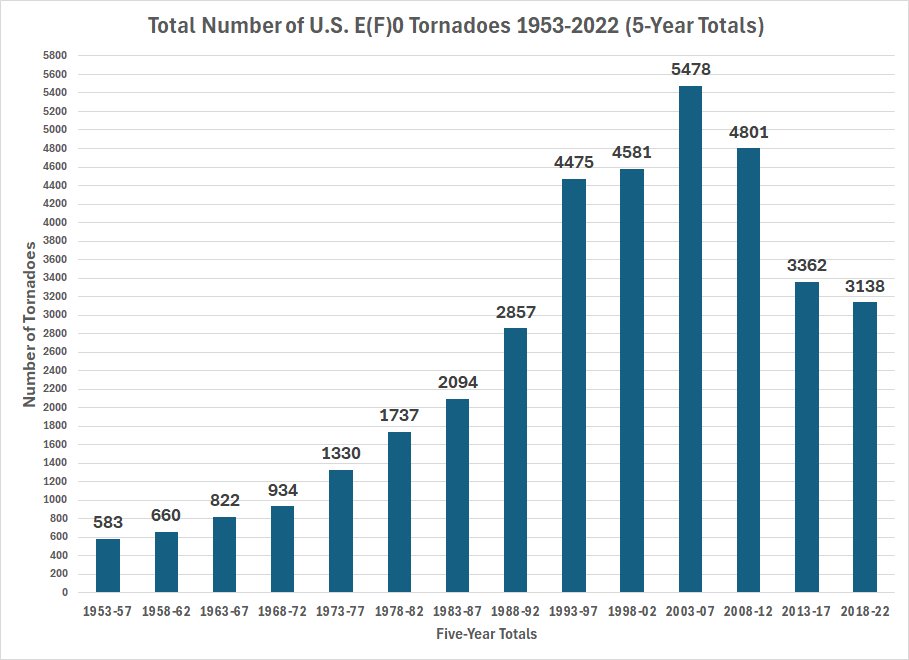
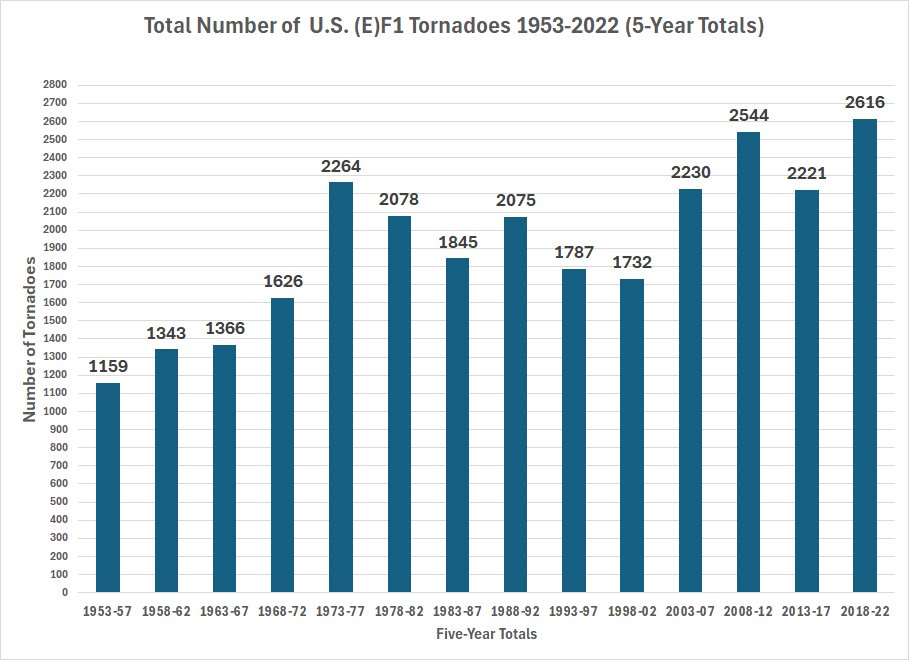
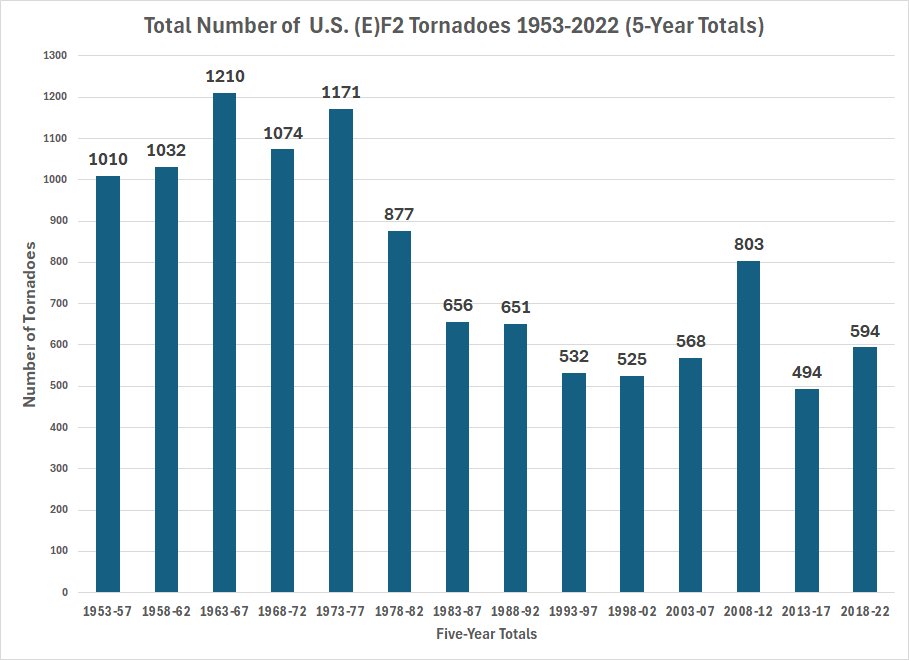
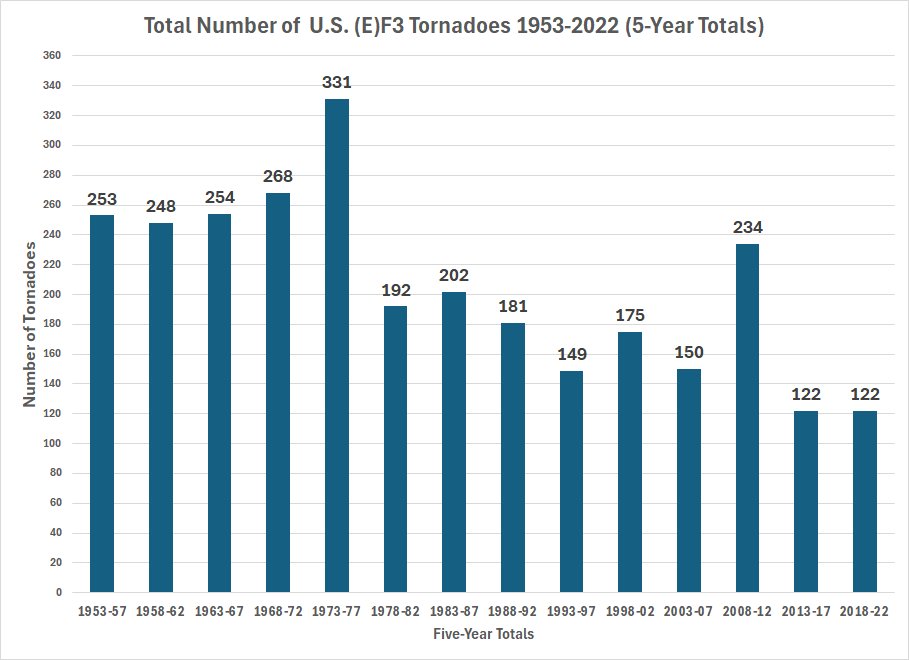
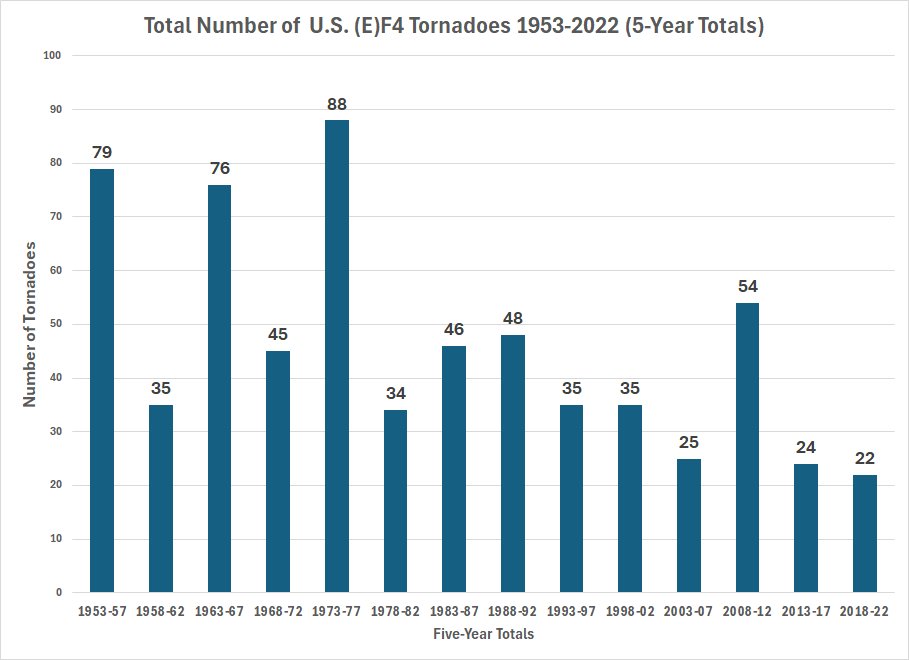
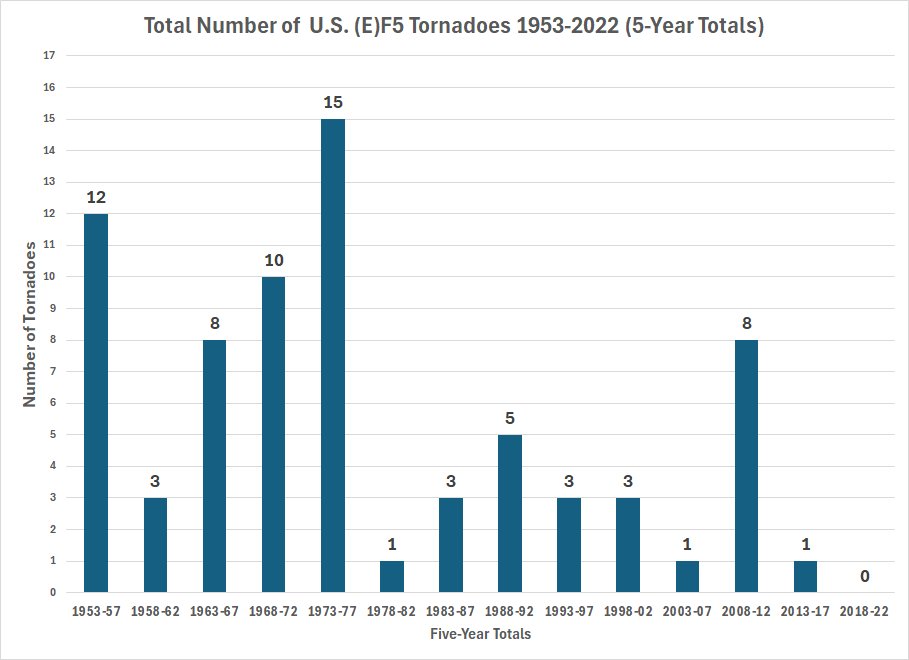
There are several graphs below the table which were created to see if there are any trends in the frequencies of different F-Scale intensities of tornadoes in the U.S.
| (E)F0 | (E)F1 | (E)F2 | (E)F3 | (E)F4 | (E)F5 | TOTALS | |
| 1953-57 | 583 | 1159 | 1010 | 253 | 79 | 12 | 3096 |
| 1958-62 | 660 | 1343 | 1032 | 248 | 35 | 3 | 3321 |
| 1963-67 | 822 | 1366 | 1210 | 254 | 76 | 8 | 3736 |
| 1968-72 | 934 | 1626 | 1074 | 268 | 45 | 10 | 3957 |
| 1973-77 | 1330 | 2264 | 1171 | 331 | 88 | 15 | 5199 |
| 1978-82 | 1737 | 2078 | 877 | 192 | 34 | 1 | 4919 |
| 1983-87 | 2094 | 1845 | 656 | 202 | 46 | 3 | 4846 |
| 1988-92 | 2857 | 2075 | 651 | 181 | 48 | 5 | 5817 |
| 1993-97 | 4475 | 1787 | 532 | 149 | 35 | 3 | 6981 |
| 1998-02 | 4581 | 1732 | 525 | 175 | 35 | 3 | 7051 |
| 2003-07 | 5478 | 2230 | 568 | 150 | 25 | 1 | 8452 |
| 2008-12 | 4801 | 2544 | 803 | 234 | 54 | 8 | 8444 |
| 2013-17 | 3362 | 2221 | 494 | 122 | 24 | 1 | 6224 |
| 2018-22 | 3138 | 2616 | 594 | 122 | 22 | 0 | 6492 |
| TOTALS | 36852 | 26886 | 11197 | 2881 | 646 | 73 | 78535 |
Five year totals of U.S. tornadoes grouped by (E)F scales.
__
.